Fig. 6.
Download original image
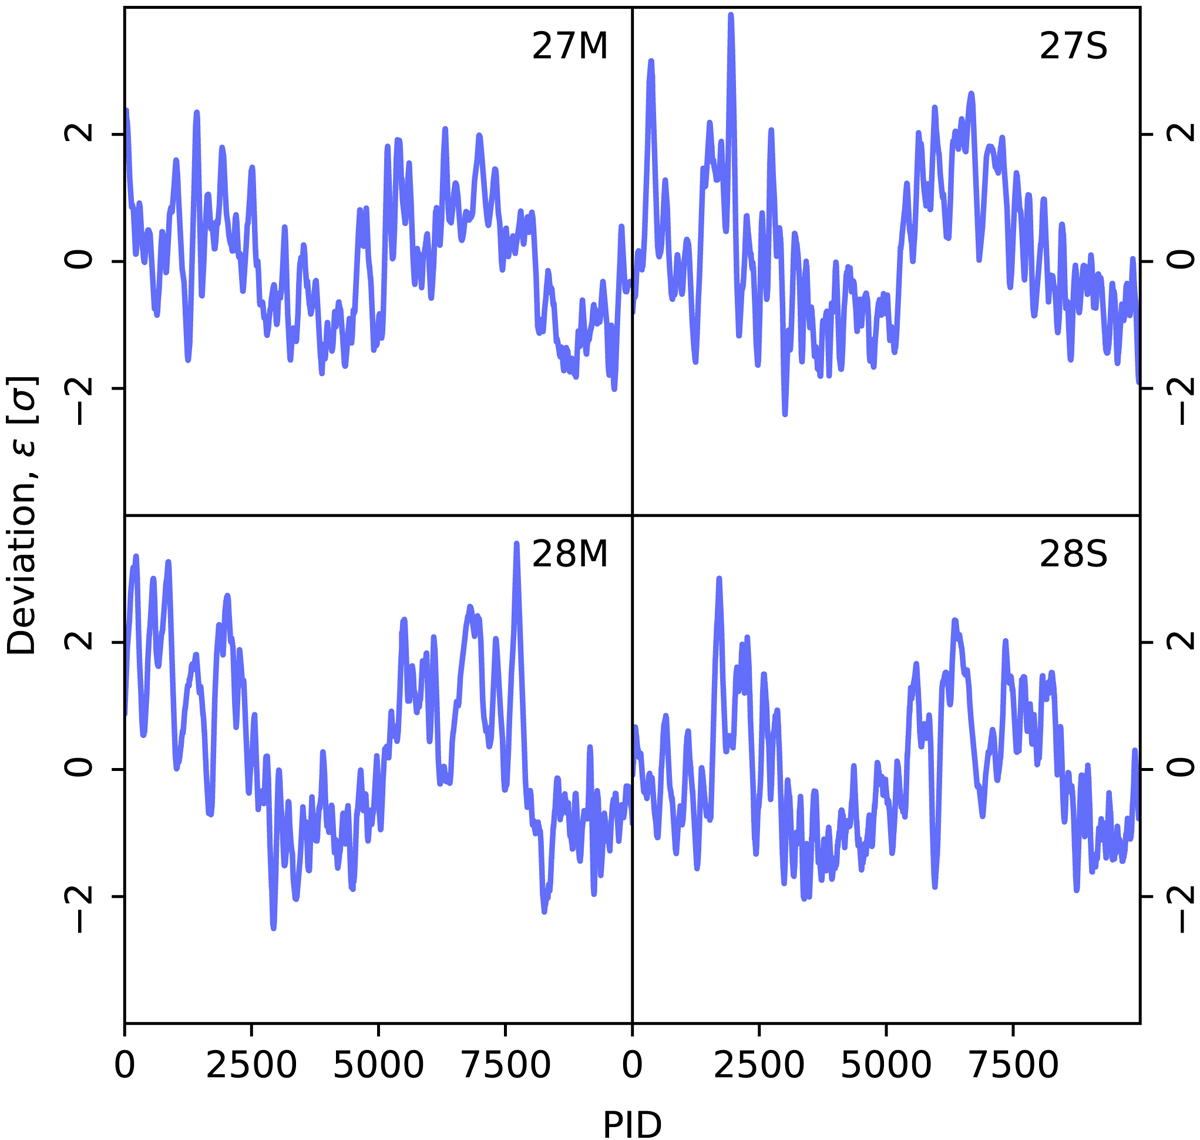
Deviation of the mean output gain solution from the input gain for each PID and 30 GHz detector in our simulation run. The deviations are measured in sample standard deviations.
Current usage metrics show cumulative count of Article Views (full-text article views including HTML views, PDF and ePub downloads, according to the available data) and Abstracts Views on Vision4Press platform.
Data correspond to usage on the plateform after 2015. The current usage metrics is available 48-96 hours after online publication and is updated daily on week days.
Initial download of the metrics may take a while.