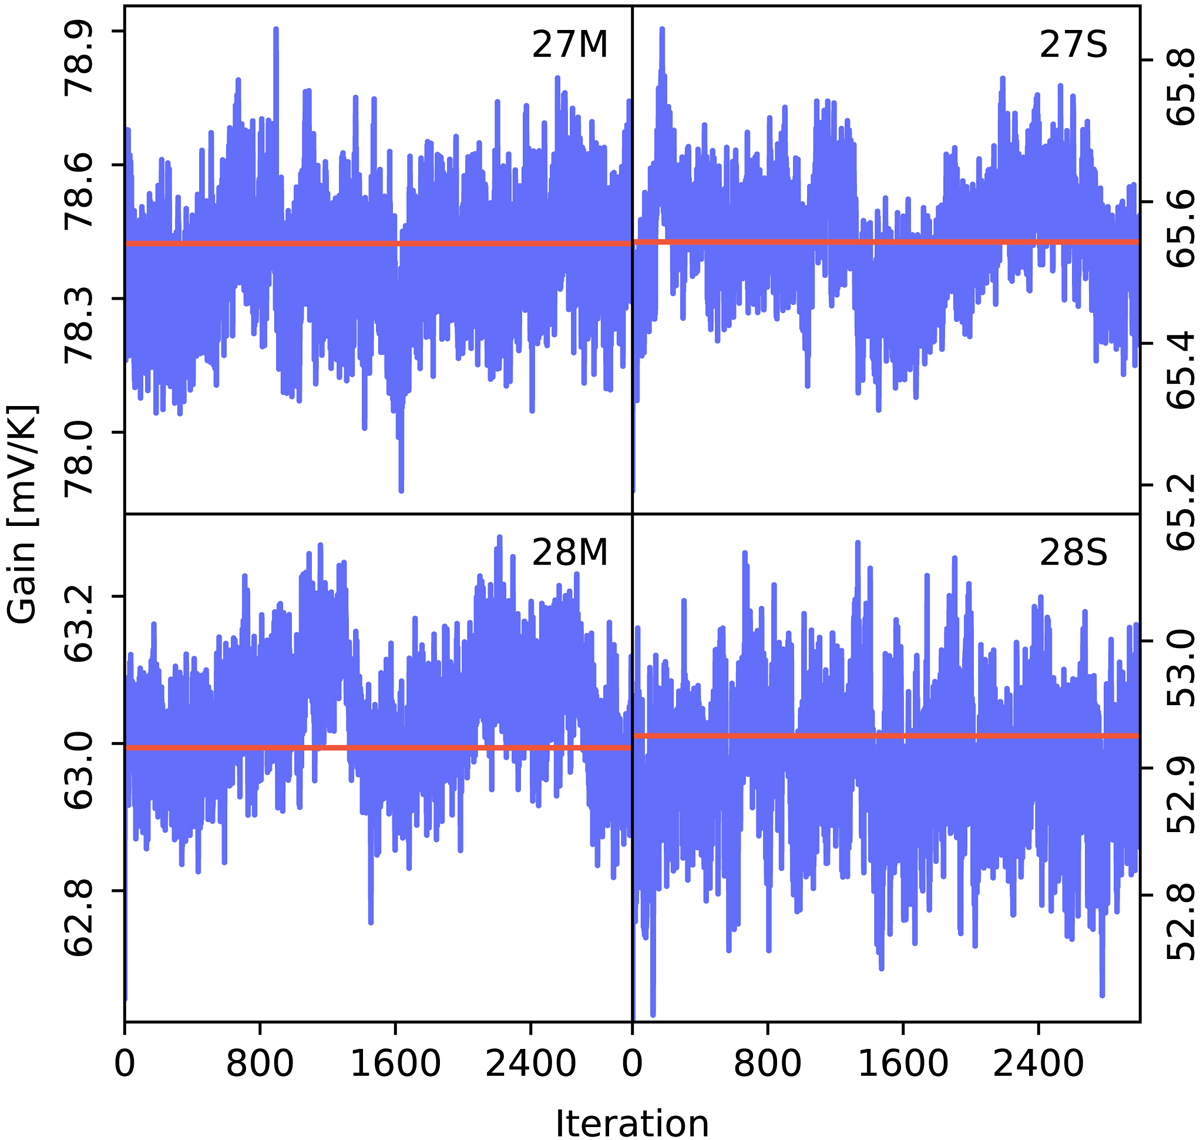
Fig. 5.
Download original image
Trace plots of samples of the total gain for randomly selected PIDs for each of the four 30 GHz detectors for our simulation run. The PIDs are, respectively, 349, 9847, 4298, and 1993. The red lines signify the input gain values.
Current usage metrics show cumulative count of Article Views (full-text article views including HTML views, PDF and ePub downloads, according to the available data) and Abstracts Views on Vision4Press platform.
Data correspond to usage on the plateform after 2015. The current usage metrics is available 48-96 hours after online publication and is updated daily on week days.
Initial download of the metrics may take a while.