Fig. 15.
Download original image
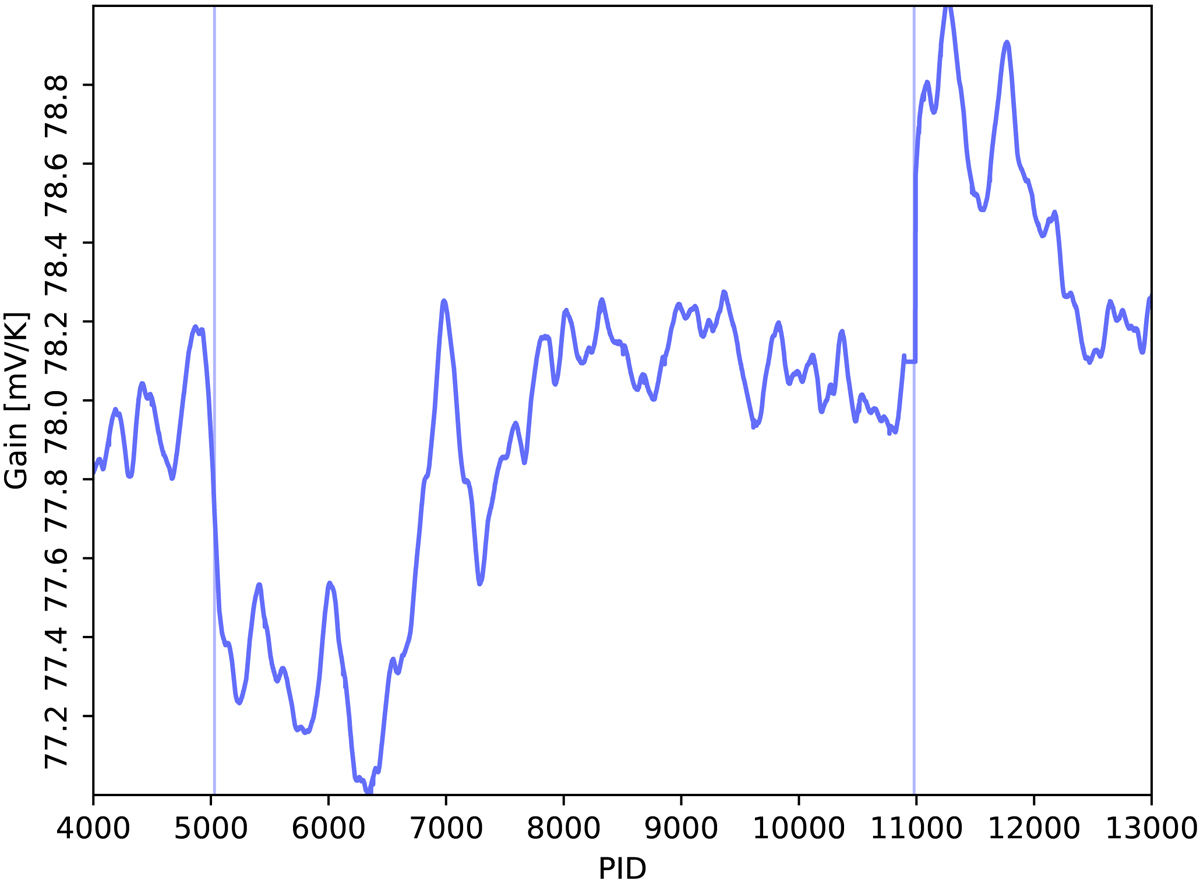
Examples of jumps seen in the gain factors. The line shows the Wiener filter solution for the 27M detector, while the vertical lines show the locations of the jumps. The jump at around PID 11000 is the sorption cooler switch-over event, mentioned in Sect. 5.3.
Current usage metrics show cumulative count of Article Views (full-text article views including HTML views, PDF and ePub downloads, according to the available data) and Abstracts Views on Vision4Press platform.
Data correspond to usage on the plateform after 2015. The current usage metrics is available 48-96 hours after online publication and is updated daily on week days.
Initial download of the metrics may take a while.