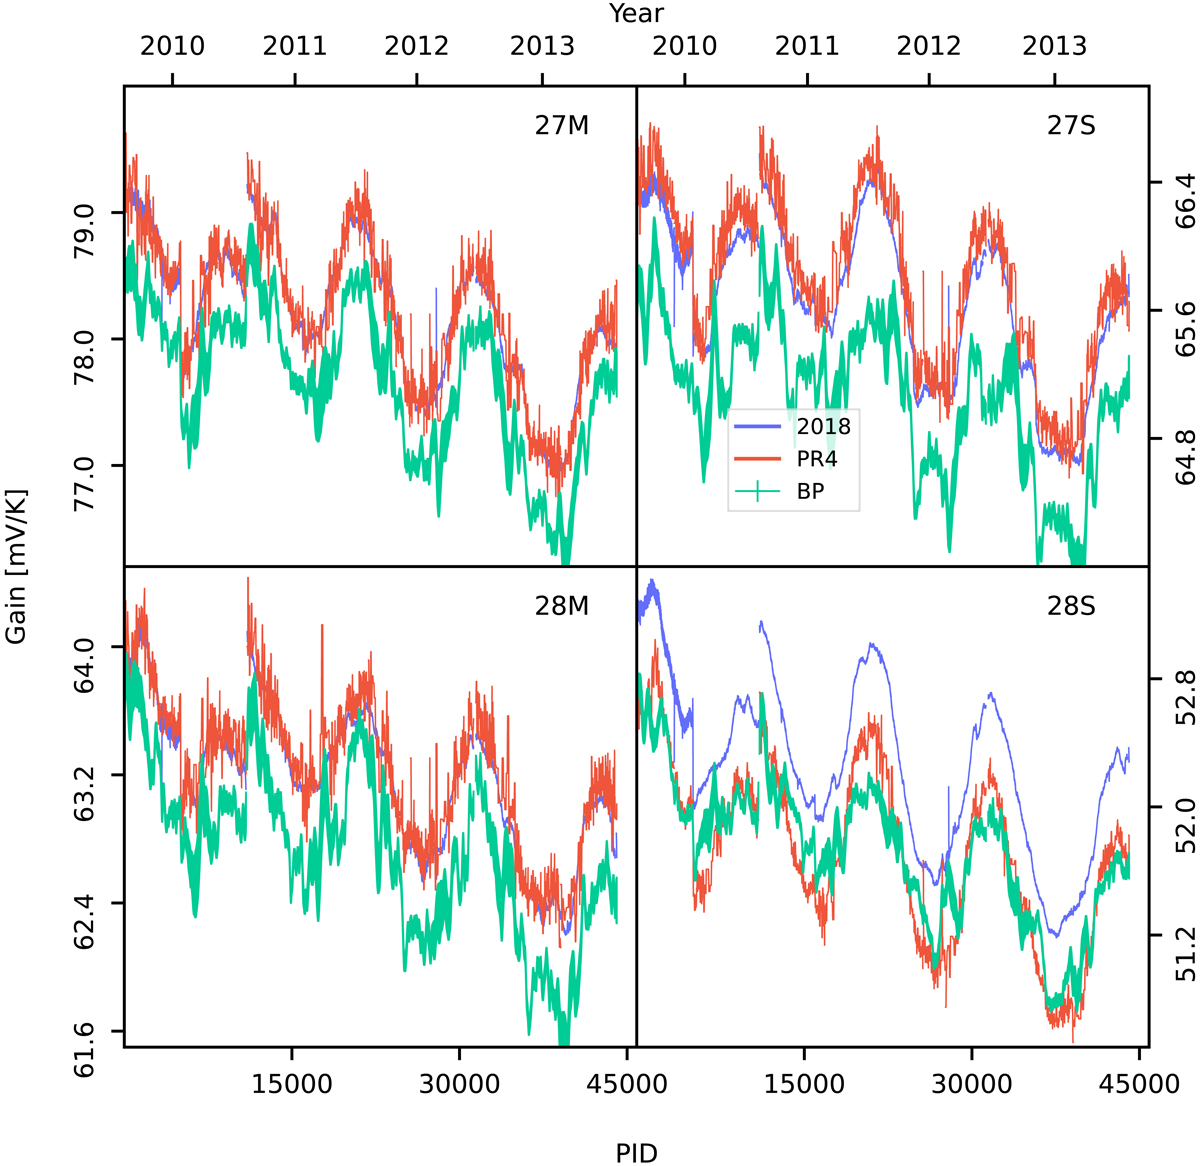
Fig. 11.
Download original image
Comparison of gain estimates for the 30 GHz detectors for Planck 2018, Planck PR4, and BEYONDPLANCK. The width of the BEYONDPLANCK line is given by the Monte Carlo uncertainty of the chains. The top x-axis ticks show the date of January 1 of the year marked.
Current usage metrics show cumulative count of Article Views (full-text article views including HTML views, PDF and ePub downloads, according to the available data) and Abstracts Views on Vision4Press platform.
Data correspond to usage on the plateform after 2015. The current usage metrics is available 48-96 hours after online publication and is updated daily on week days.
Initial download of the metrics may take a while.