Fig. 1.
Download original image
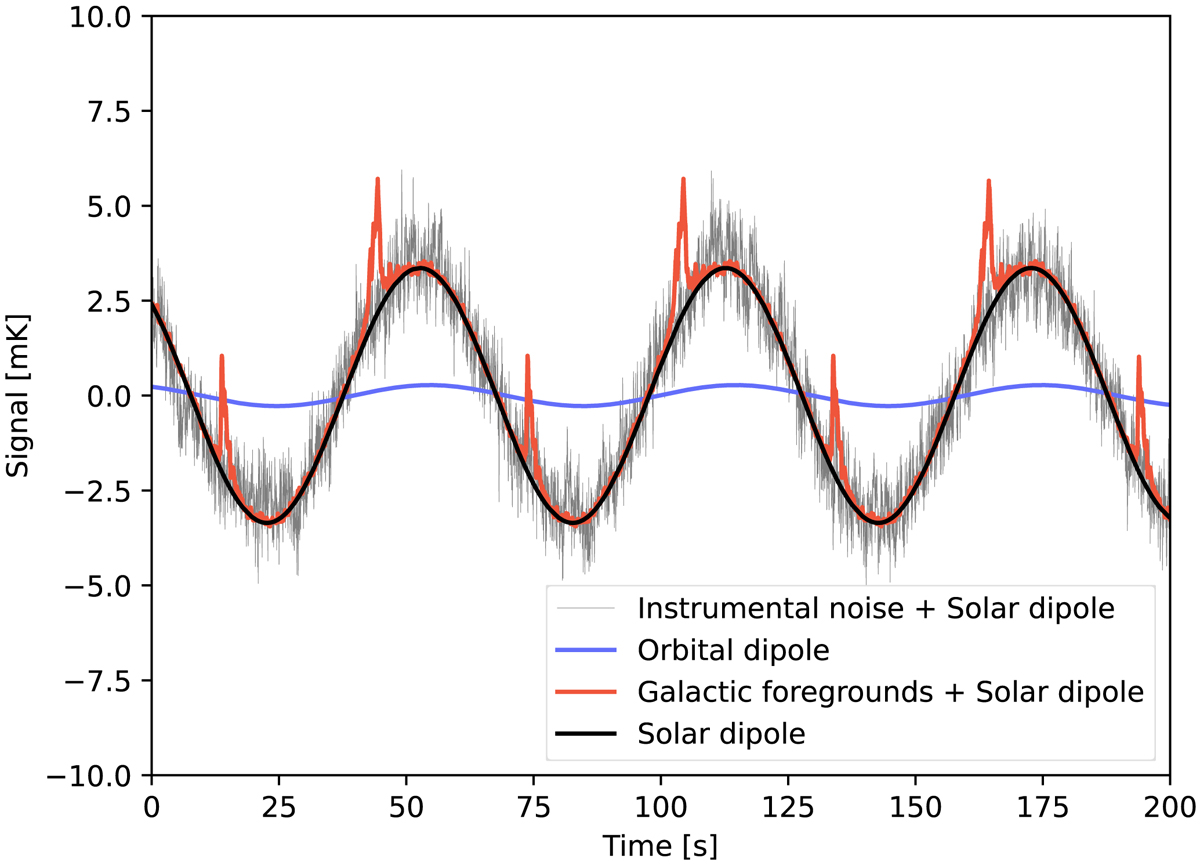
Comparison of different contributions to the time-ordered data seen by Planck at 30 GHz, for a PID whose spin orientation is close to perpendicular to the dipole axis. The blue and black curves show the orbital and Solar CMB dipoles, respectively. The red and grey lines show the Solar CMB dipole with galactic foregrounds and instrumental noise added, respectively.
Current usage metrics show cumulative count of Article Views (full-text article views including HTML views, PDF and ePub downloads, according to the available data) and Abstracts Views on Vision4Press platform.
Data correspond to usage on the plateform after 2015. The current usage metrics is available 48-96 hours after online publication and is updated daily on week days.
Initial download of the metrics may take a while.