Open Access
Fig. 8.
Download original image
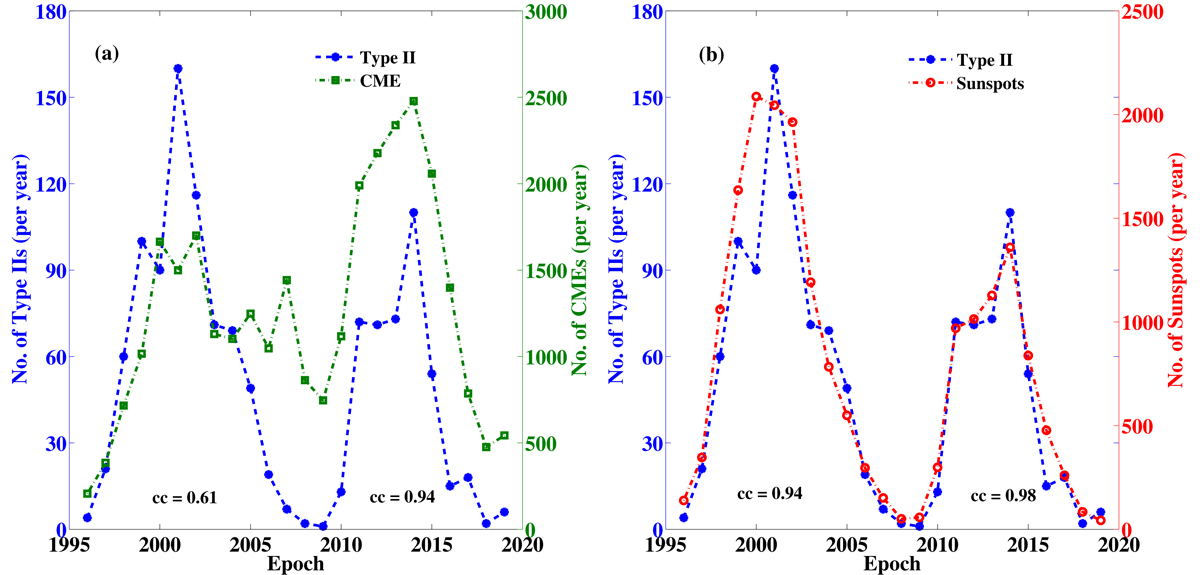
Number of CMEs (per year) and type II bursts (per year) from 1996 to 2019 in the left panel and number of type II (per year) and sunspots (per year) in the right panel.
Current usage metrics show cumulative count of Article Views (full-text article views including HTML views, PDF and ePub downloads, according to the available data) and Abstracts Views on Vision4Press platform.
Data correspond to usage on the plateform after 2015. The current usage metrics is available 48-96 hours after online publication and is updated daily on week days.
Initial download of the metrics may take a while.