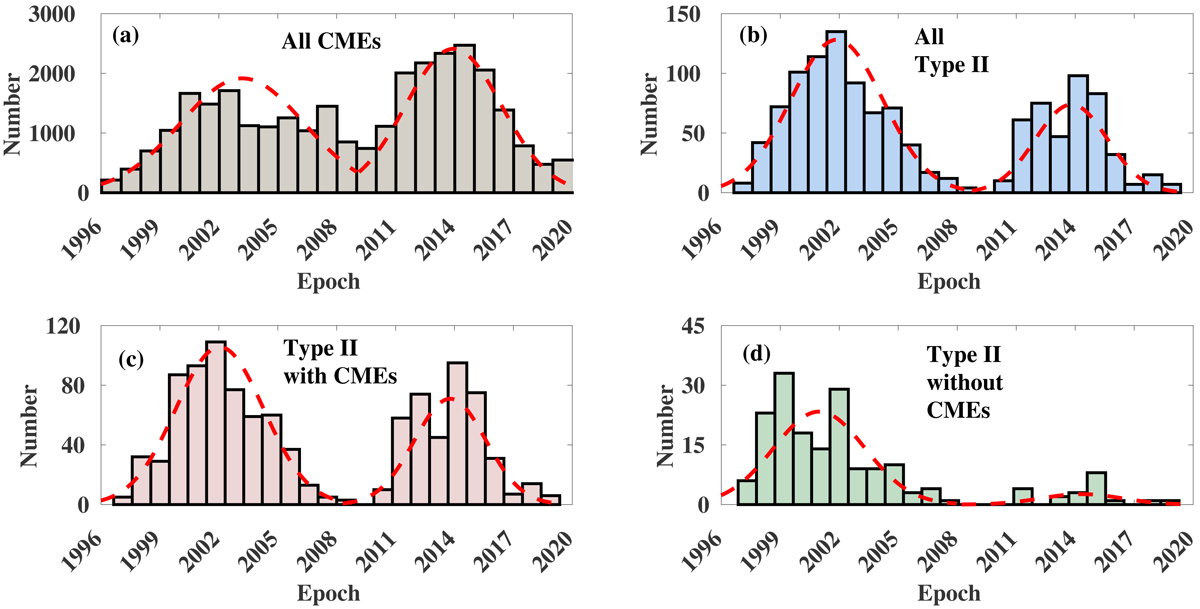
Fig. 2.
Download original image
Histograms showing the distribution of the occurrence of (a) all CMEs, (b) all type II bursts, (c) all type II bursts that were accompanied with white-light CMEs, and (d) all type II bursts without any association with a CME from January 1996, to December 2019. This corresponds to solar cycles 23 and 24. The dashed red profile shows the Gaussian fit to the histograms. The two peaks of these Gaussian peaks correspond to the solar maxima in the respective solar cycles.
Current usage metrics show cumulative count of Article Views (full-text article views including HTML views, PDF and ePub downloads, according to the available data) and Abstracts Views on Vision4Press platform.
Data correspond to usage on the plateform after 2015. The current usage metrics is available 48-96 hours after online publication and is updated daily on week days.
Initial download of the metrics may take a while.