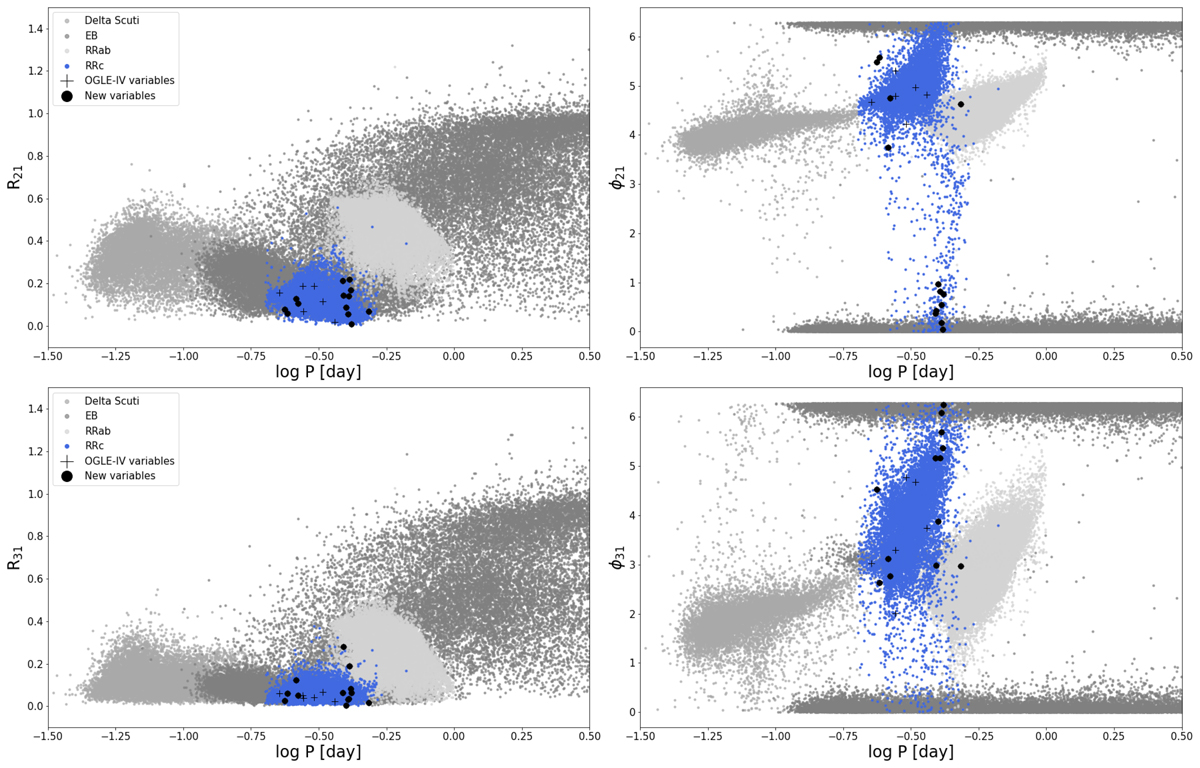
Fig. A.1.
Download original image
Example of the plots that we used to classify the pulsators based on their relative Fourier parameters, in this case RRc variables (blue). The background is composed of the known OGLE variable stars (except the Cepheids), as in Fig. 5 but now coloured in shades of grey. The dots denote the newly found variables. The crosses mark the ones that turned out to be the results of contamination by known close variables (listed in Table 1).
Current usage metrics show cumulative count of Article Views (full-text article views including HTML views, PDF and ePub downloads, according to the available data) and Abstracts Views on Vision4Press platform.
Data correspond to usage on the plateform after 2015. The current usage metrics is available 48-96 hours after online publication and is updated daily on week days.
Initial download of the metrics may take a while.