Fig. 6.
Download original image
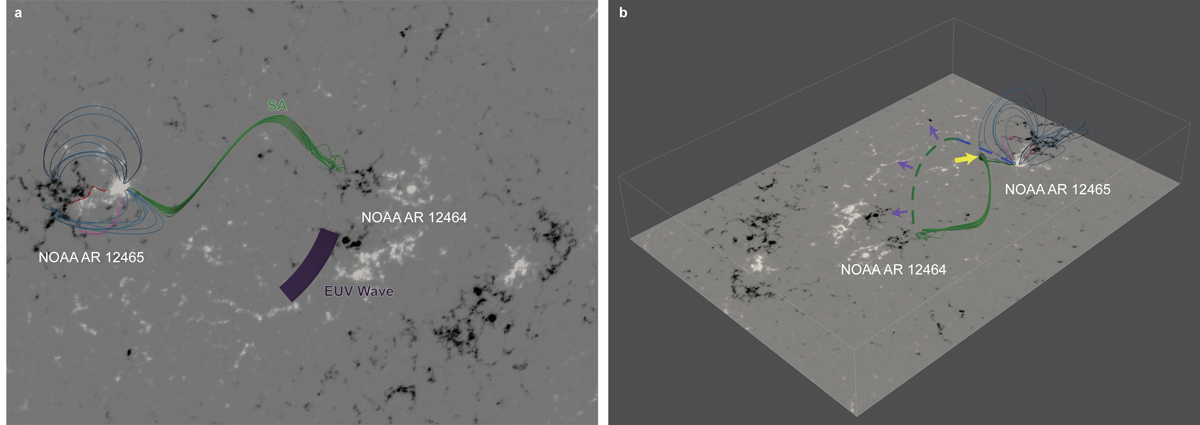
Schematic drawing of the possible scenario for the wave formation. (a) Relationship between the EUV wave (the deep blue shade) and the SAs, overlaid on the HMI vector magnetogram at ∼16:36 UT. The magnetic structures in the source AR are the same as those in Fig. 1c. (b) The possible scenario for the expansion (purple arrows) of the releasing strands of SAs (the dashed green-blue line) in a side view. The yellow arrow points out the possible sites of magnetic reconnection.
Current usage metrics show cumulative count of Article Views (full-text article views including HTML views, PDF and ePub downloads, according to the available data) and Abstracts Views on Vision4Press platform.
Data correspond to usage on the plateform after 2015. The current usage metrics is available 48-96 hours after online publication and is updated daily on week days.
Initial download of the metrics may take a while.