Fig. 4.
Download original image
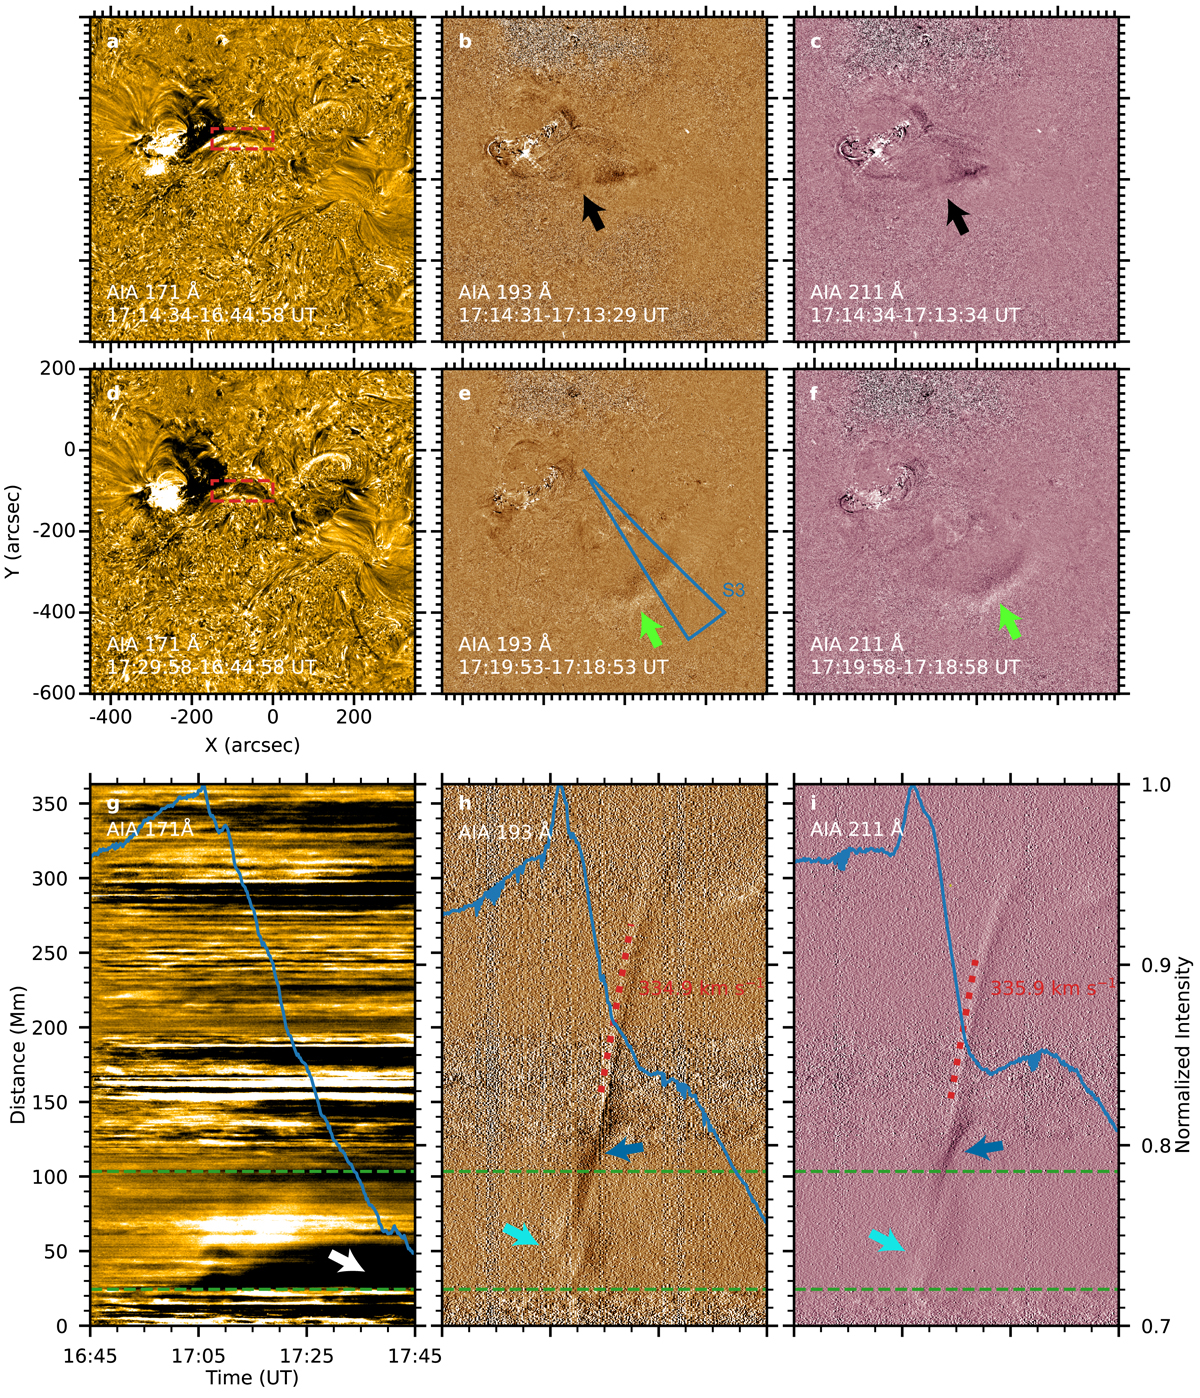
EUV wave in difference images of AIA 171, 193, and 211 Å. (a)–(f) The red boxes show the region of SAs, and the green and black arrows separately indicate the EUV wave and the expanding loops. (g)–(i) Time-distance plots along S3 (the blue sector in panel e), overlaid with the normalized intensity changes (blue curves) within the red square in panels a and d. The dotted red lines show the speeds of the wavefront. The white arrow indicates the long-duration dimmings, cyan arrows indicate the faint brightening, and blue arrows indicate the loop-like dimmings. The dashed green lines represent the boundaries of the region of the red square in panels a and d.
Current usage metrics show cumulative count of Article Views (full-text article views including HTML views, PDF and ePub downloads, according to the available data) and Abstracts Views on Vision4Press platform.
Data correspond to usage on the plateform after 2015. The current usage metrics is available 48-96 hours after online publication and is updated daily on week days.
Initial download of the metrics may take a while.