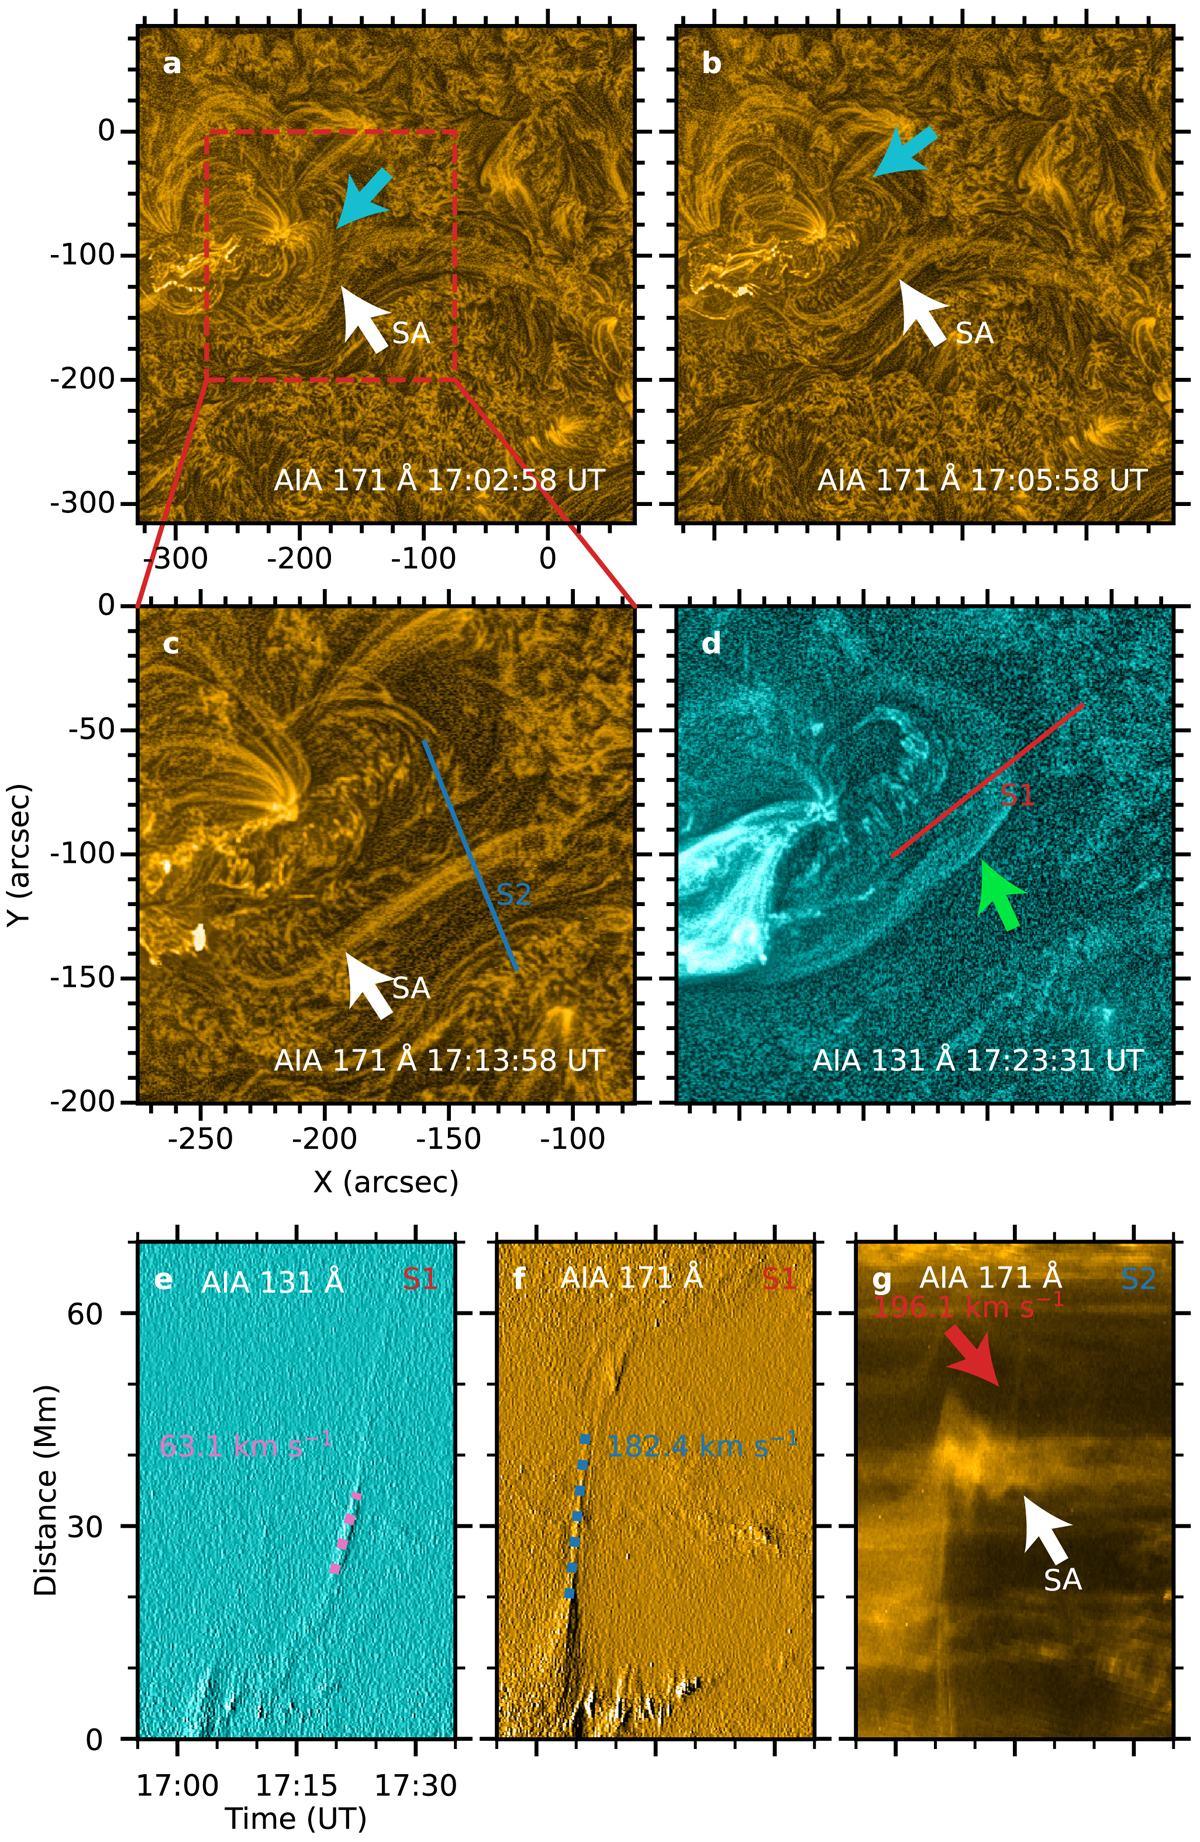
Fig. 3.
Download original image
Interaction between the eruption and SAs. (a)–(d) Interaction process. White arrows indicate SAs, and cyan arrows indicate the erupting loops wrapping the flux rope (the green arrow). The red box represents the FOV of panels c,d. (e)–(g) Time-distance plots along S1 and S2 (red and blue lines in panels c,d). The dotted lines show the expansion speeds of the flux rope (pink), the loops (blue), and the strands (red) of SAs (the white arrow).
Current usage metrics show cumulative count of Article Views (full-text article views including HTML views, PDF and ePub downloads, according to the available data) and Abstracts Views on Vision4Press platform.
Data correspond to usage on the plateform after 2015. The current usage metrics is available 48-96 hours after online publication and is updated daily on week days.
Initial download of the metrics may take a while.