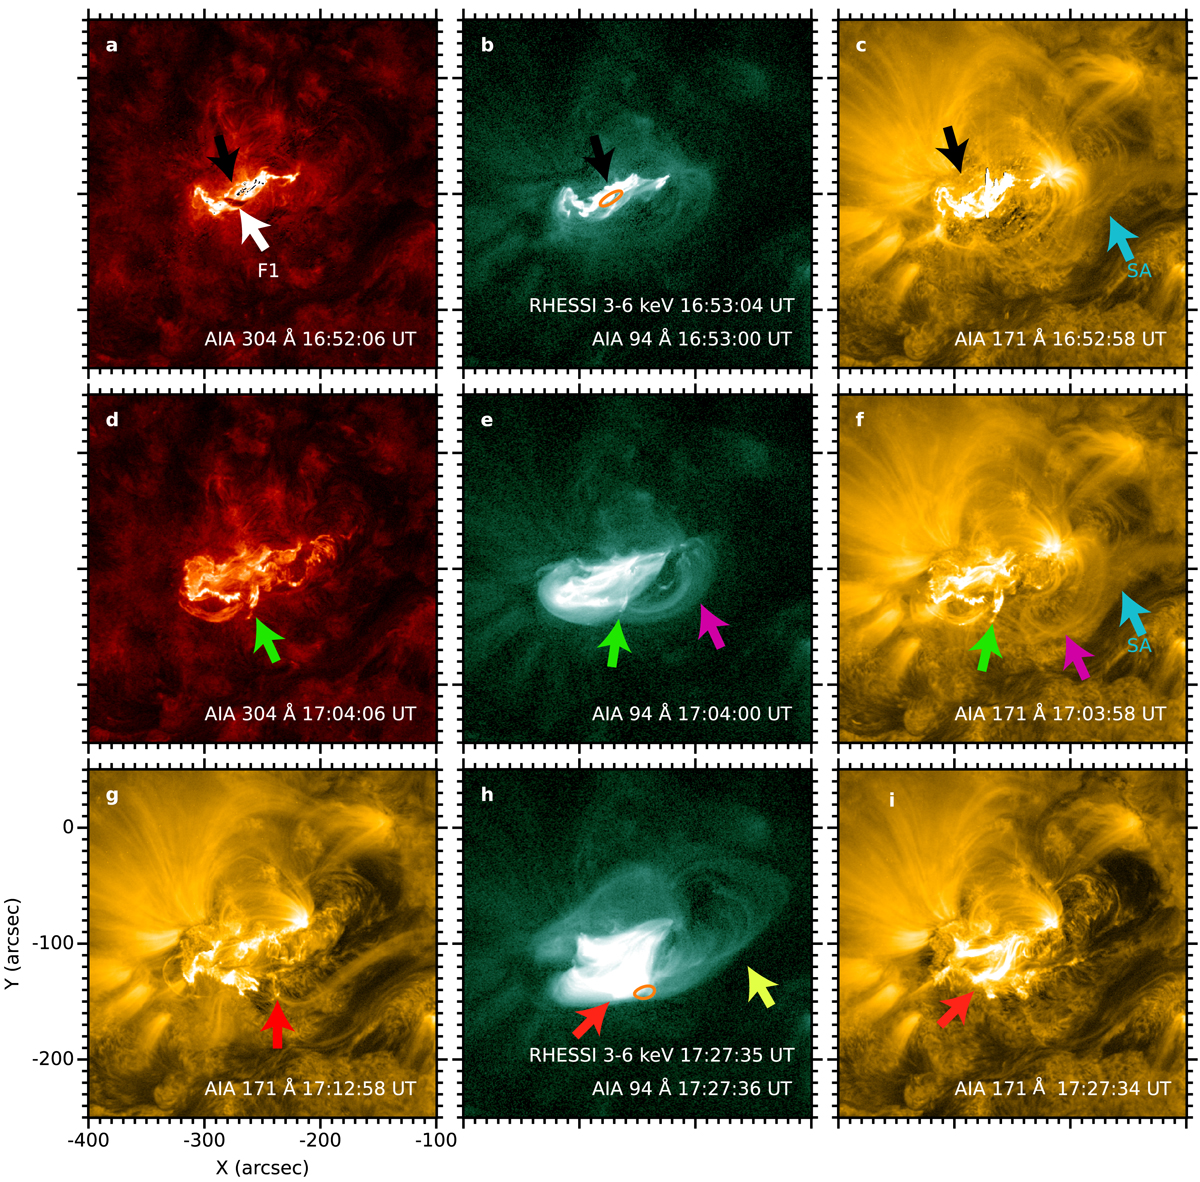
Fig. 2.
Download original image
Two-step energy release. (a)–(c) First step. Black arrows indicate the flare ribbons, and the white and blue arrows indicate the filament of F1 and SAs, separately. The orange contour represents the X-ray source of RHESSI 3–6 keV. (d)–(i) Second step. Green arrows indicate the break of the erupting structures of F1, and pink arrows indicate the overlying coronal loops. The yellow arrow indicates the newly formed longer flux rope, and red arrows indicate the post-flare arcade in the second step. The orange contour indicates the X-ray source of RHESSI 3–6 keV. The red arrows indicate the brightenings that are possibly related to the magnetic reconnection between the SAs and the longer flux rope.
Current usage metrics show cumulative count of Article Views (full-text article views including HTML views, PDF and ePub downloads, according to the available data) and Abstracts Views on Vision4Press platform.
Data correspond to usage on the plateform after 2015. The current usage metrics is available 48-96 hours after online publication and is updated daily on week days.
Initial download of the metrics may take a while.