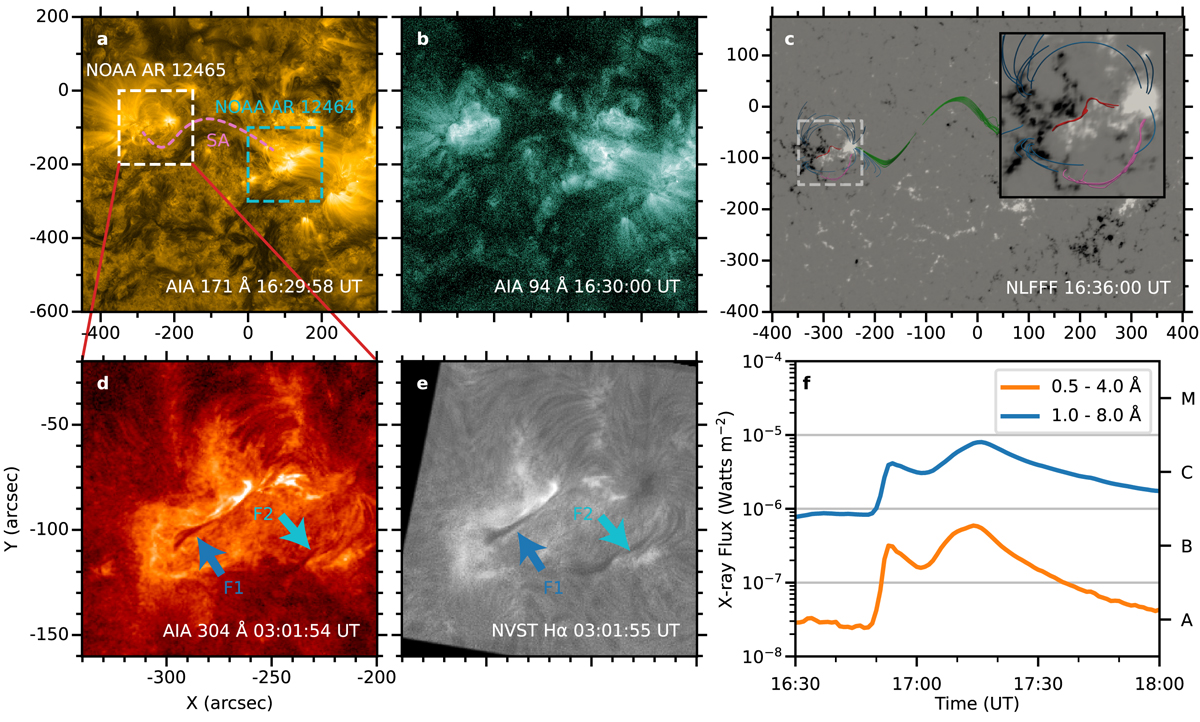
Fig. 1.
Download original image
Overview of pre-eruption environment. (a),(b) Coronal environment of NOAA ARs of 12465 (the white square) and 12464 (the cyan square) in AIA 171 and 94 Å. The purple curve indicates the magnetic SAs. (c) NLFFF extrapolated field lines, superposing on the HMI vector magnetogram at 16:36 UT, show the filaments (red and pink), the overlying coronal loops (blue), and the SAs (green). The configuration of NOAA AR 12465 is in the enlarged view in the top-right corner. (d),(e) Filaments of F1 (blue arrows) and F2 (green arrows) in AIA 304 Å and NVST Hα. (f) GOES soft X-ray flux of the C9.6-class flare in channel 1.0–8.0 Å (the blue curve) and 0.5–4.0 Å (the orange curve).
Current usage metrics show cumulative count of Article Views (full-text article views including HTML views, PDF and ePub downloads, according to the available data) and Abstracts Views on Vision4Press platform.
Data correspond to usage on the plateform after 2015. The current usage metrics is available 48-96 hours after online publication and is updated daily on week days.
Initial download of the metrics may take a while.