Open Access
Fig. 5
Download original image
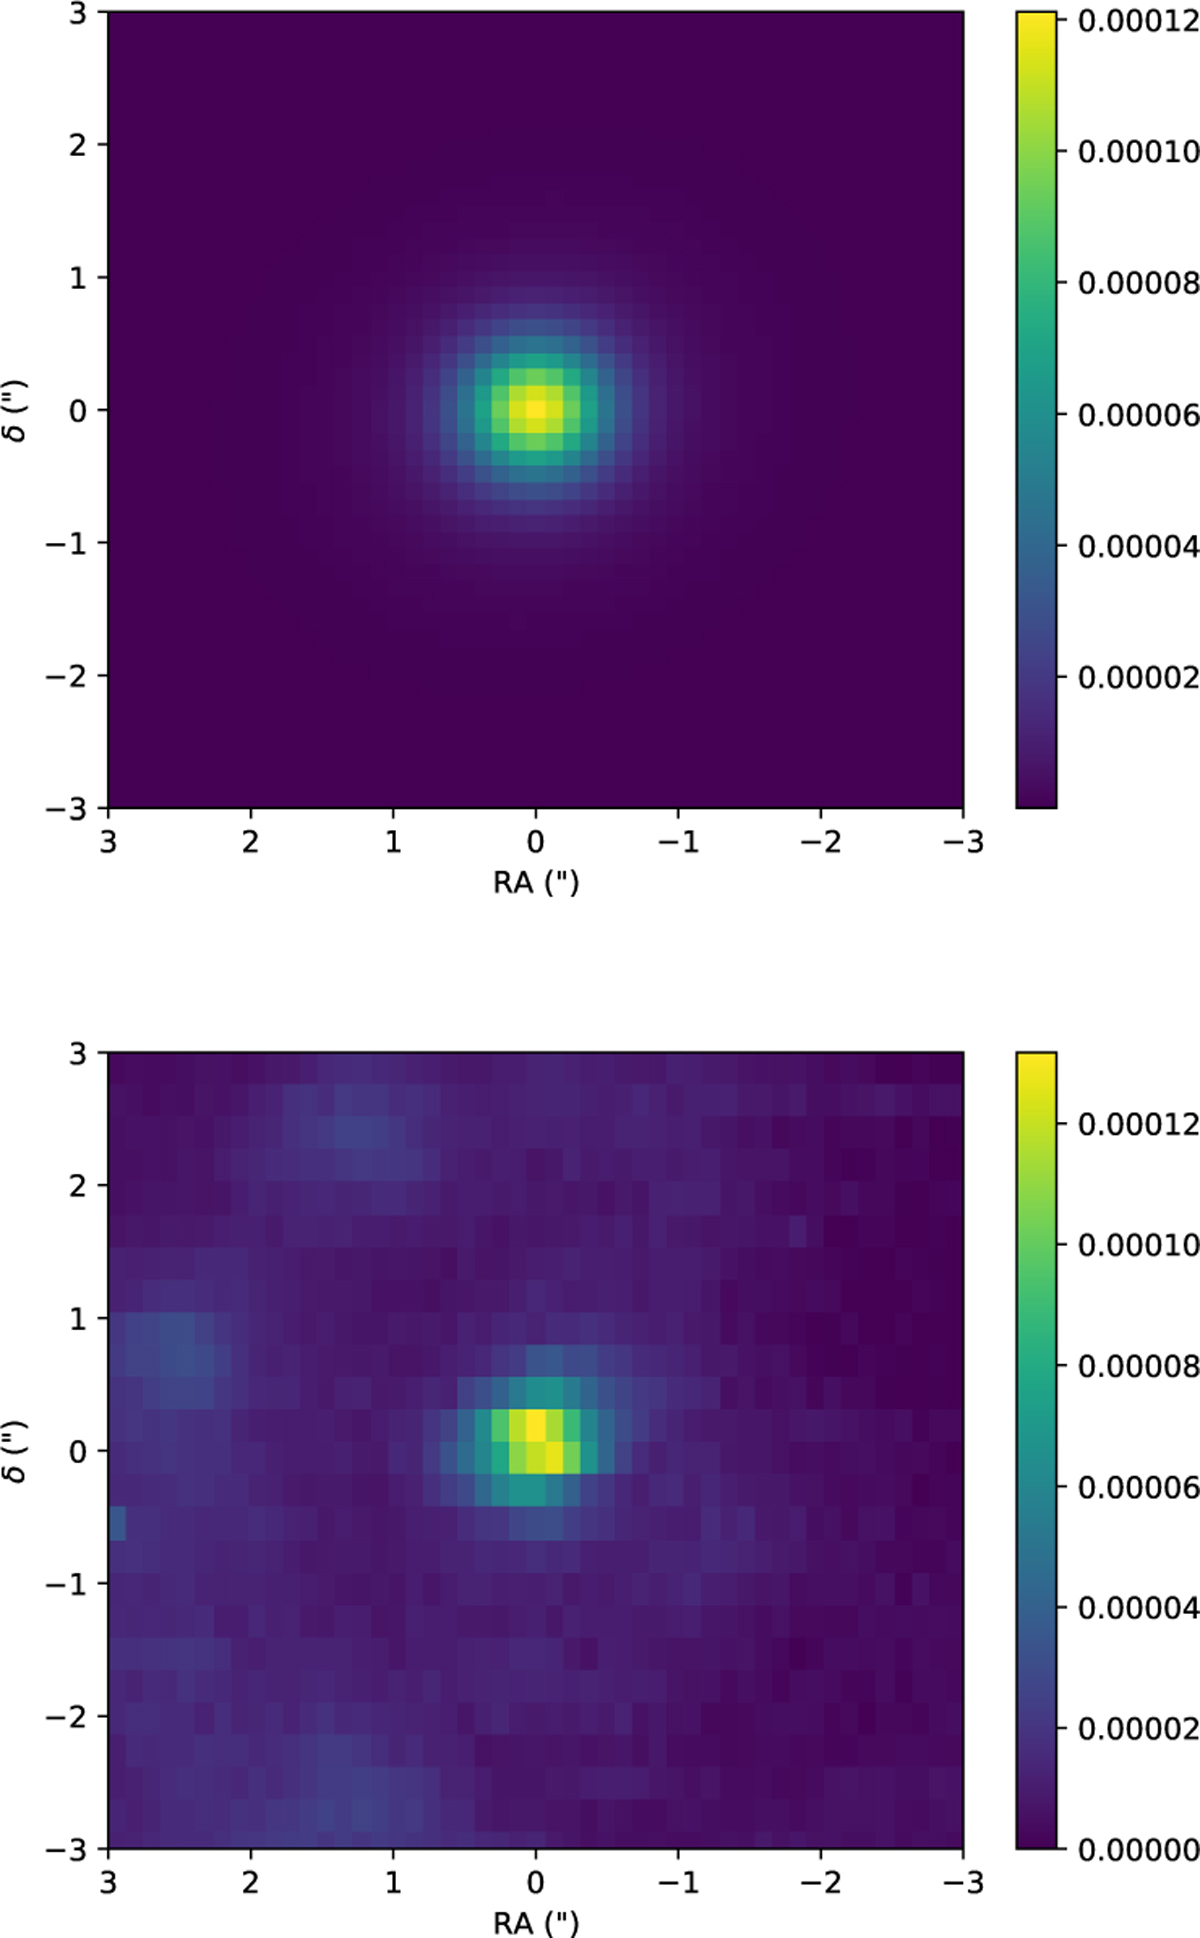
NGC 1808: 2D maps of the supernova rate (number of supernova per year and per pixel): (top) as estimated from our modeling and (bottom) as estimated from the [Fe II] emission line with the Rosenberg et al. (2012) conversion factor.
Current usage metrics show cumulative count of Article Views (full-text article views including HTML views, PDF and ePub downloads, according to the available data) and Abstracts Views on Vision4Press platform.
Data correspond to usage on the plateform after 2015. The current usage metrics is available 48-96 hours after online publication and is updated daily on week days.
Initial download of the metrics may take a while.