Fig. 1.
Download original image
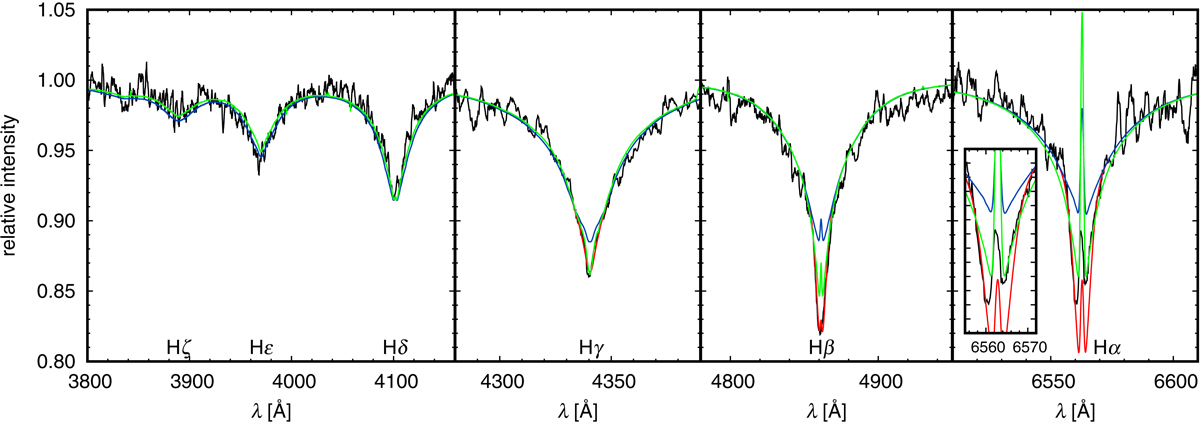
Comparison of observed and fitted spectra. The black curve denotes observed spectrum (φ = 0.332), the blue curve corresponds to the fitted spectrum, the red curve denotes the spectrum with additional magnetospheric absorption, and the green curve denotes the spectrum from the model that includes heavy elements. The inlet shows the central part of the Hα profile.
Current usage metrics show cumulative count of Article Views (full-text article views including HTML views, PDF and ePub downloads, according to the available data) and Abstracts Views on Vision4Press platform.
Data correspond to usage on the plateform after 2015. The current usage metrics is available 48-96 hours after online publication and is updated daily on week days.
Initial download of the metrics may take a while.