Fig. 8
Download original image
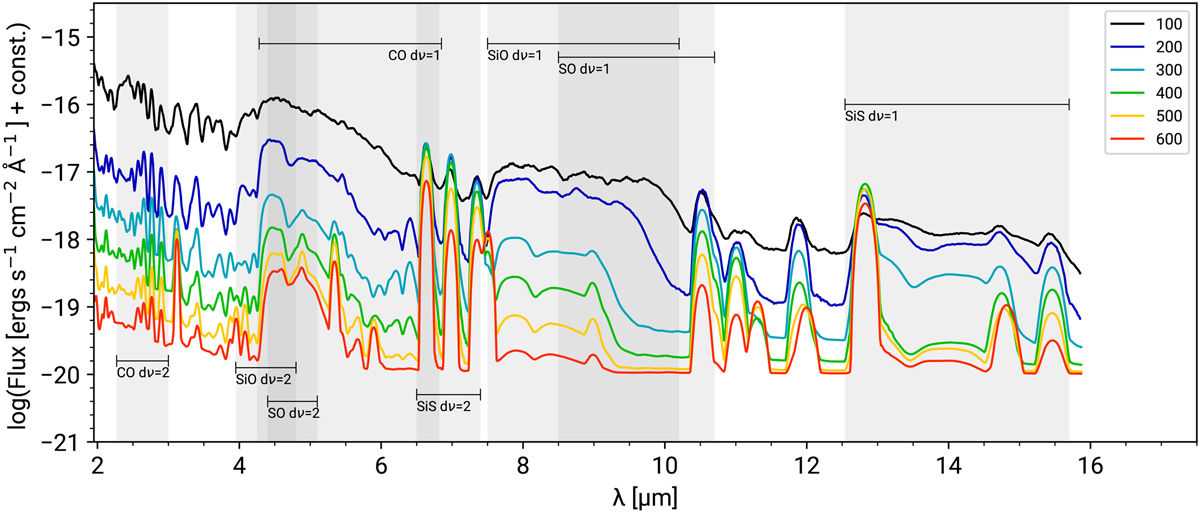
Model spectra in the MIR, where each line is the spectra at different times in days indicated by the right label, for the standard model. The fundamental (dv = 1) and first overtone (dv = 2) molecular bands are indicated. Unblended molecular emission has a light gray background, blends from two bands mid-gray, and blends from three bands dark gray. The flux here is on a log-scale.
Current usage metrics show cumulative count of Article Views (full-text article views including HTML views, PDF and ePub downloads, according to the available data) and Abstracts Views on Vision4Press platform.
Data correspond to usage on the plateform after 2015. The current usage metrics is available 48-96 hours after online publication and is updated daily on week days.
Initial download of the metrics may take a while.