Fig. 12
Download original image
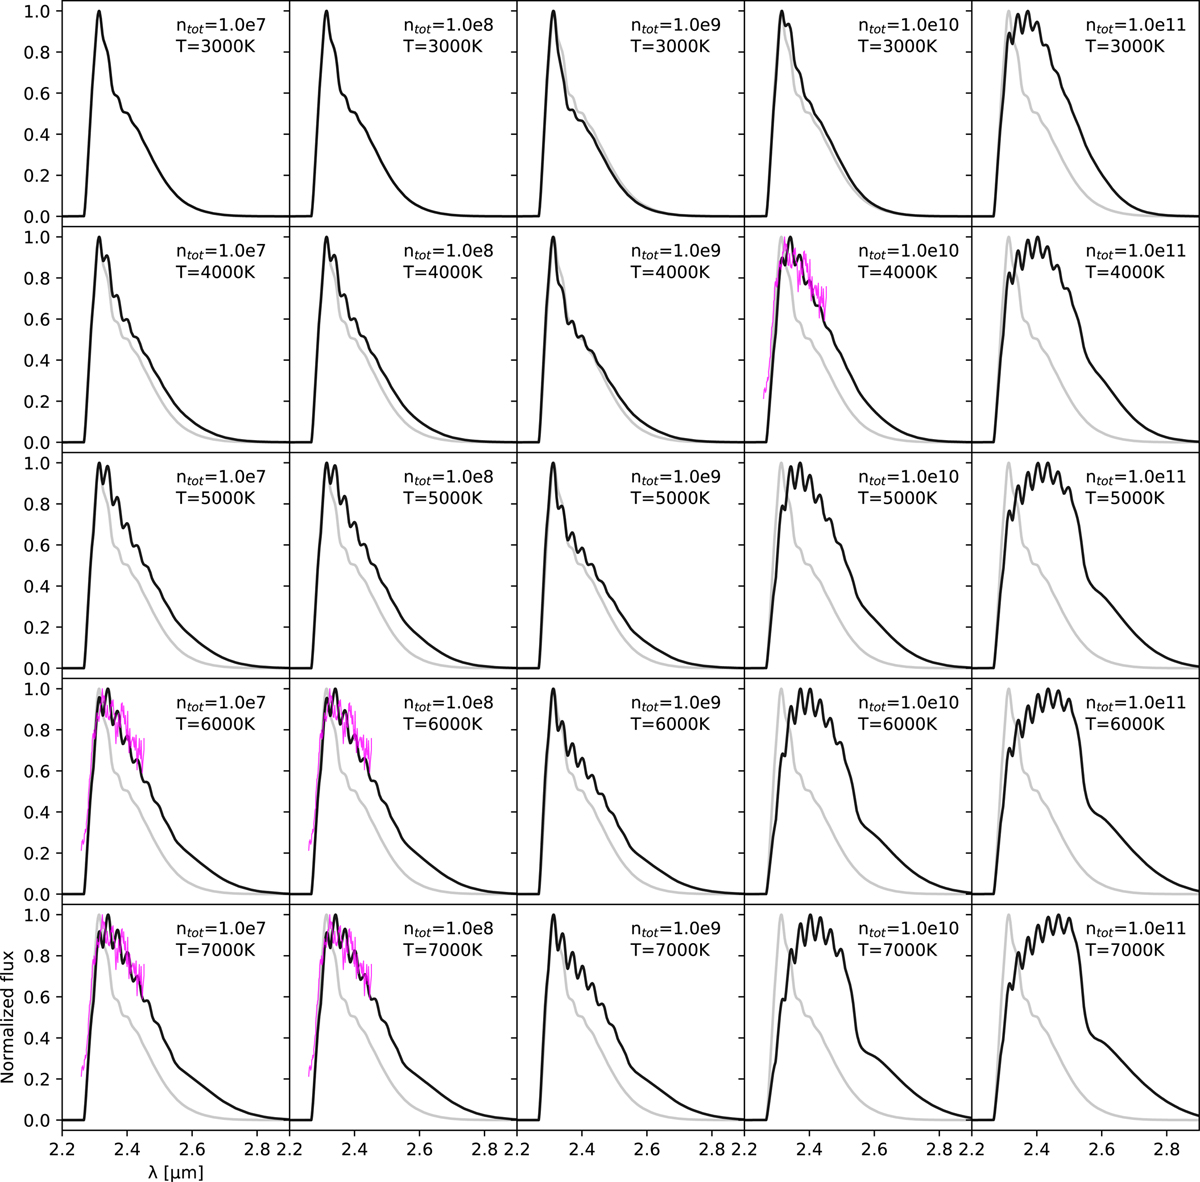
Line shapes of the CO dy = 2 line, for a grid of temperatures and densities, at 100 days. The black line is for the specified density and temperature in each panel. The gray line is for the lowest density and temperature and is used as a reference. The pink lines are observations from Hunter et al. (2009), plotted in panels where the model results are a good fit to the observations. In these simplified simulations we use nCO = 10−3ntot and ne = 0.1ntot.
Current usage metrics show cumulative count of Article Views (full-text article views including HTML views, PDF and ePub downloads, according to the available data) and Abstracts Views on Vision4Press platform.
Data correspond to usage on the plateform after 2015. The current usage metrics is available 48-96 hours after online publication and is updated daily on week days.
Initial download of the metrics may take a while.