Fig. 5.
Download original image
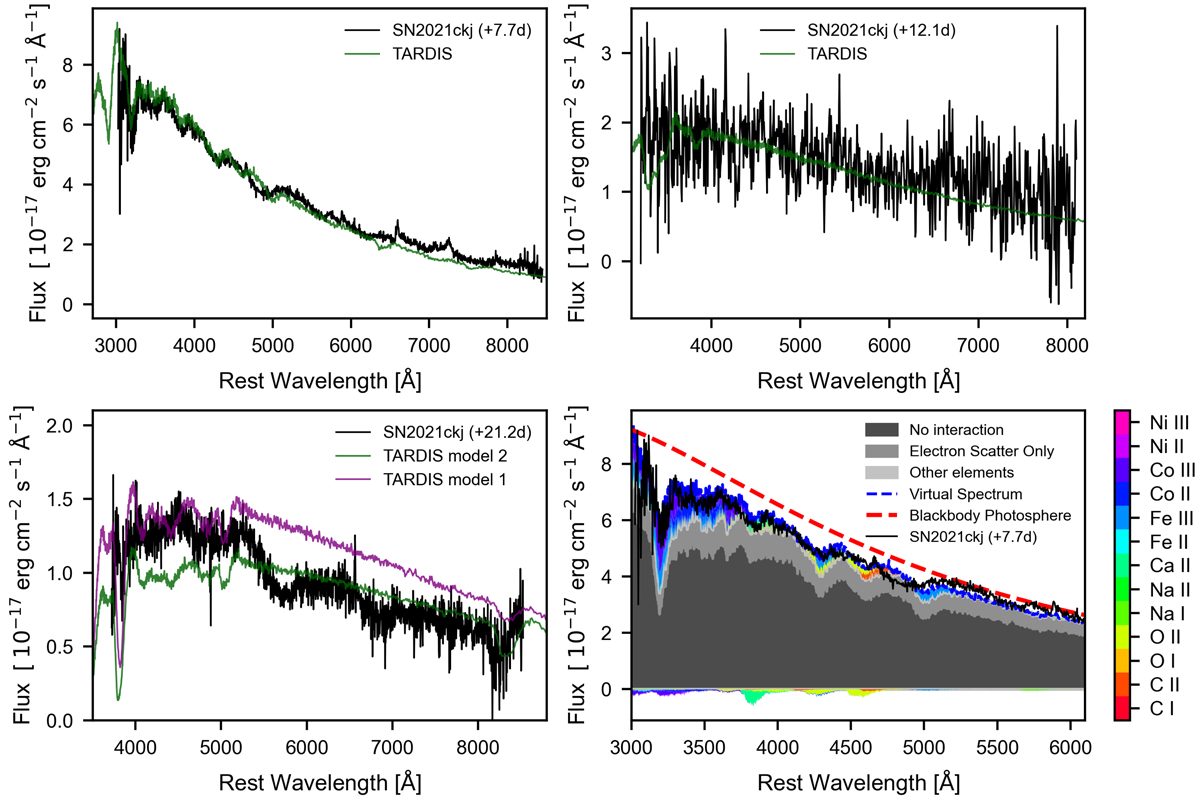
Spectral modeling of SN 2021ckj. Top left panel: comparison of our best model (green) to the observed +7.7 day spectrum (black). Top right panel: Model spectrum (green) comparison to the +12.1 day spectrum (black). Bottom left panel: TARDIS models (green for model 1 and purple for model 2) compared to the +21.2 day spectrum (black). Bottom right panel: +7.7 day spectrum Spectral element DEComposition (SDEC) plot showing the contributions of each chemical species to the synthetic spectrum.
Current usage metrics show cumulative count of Article Views (full-text article views including HTML views, PDF and ePub downloads, according to the available data) and Abstracts Views on Vision4Press platform.
Data correspond to usage on the plateform after 2015. The current usage metrics is available 48-96 hours after online publication and is updated daily on week days.
Initial download of the metrics may take a while.