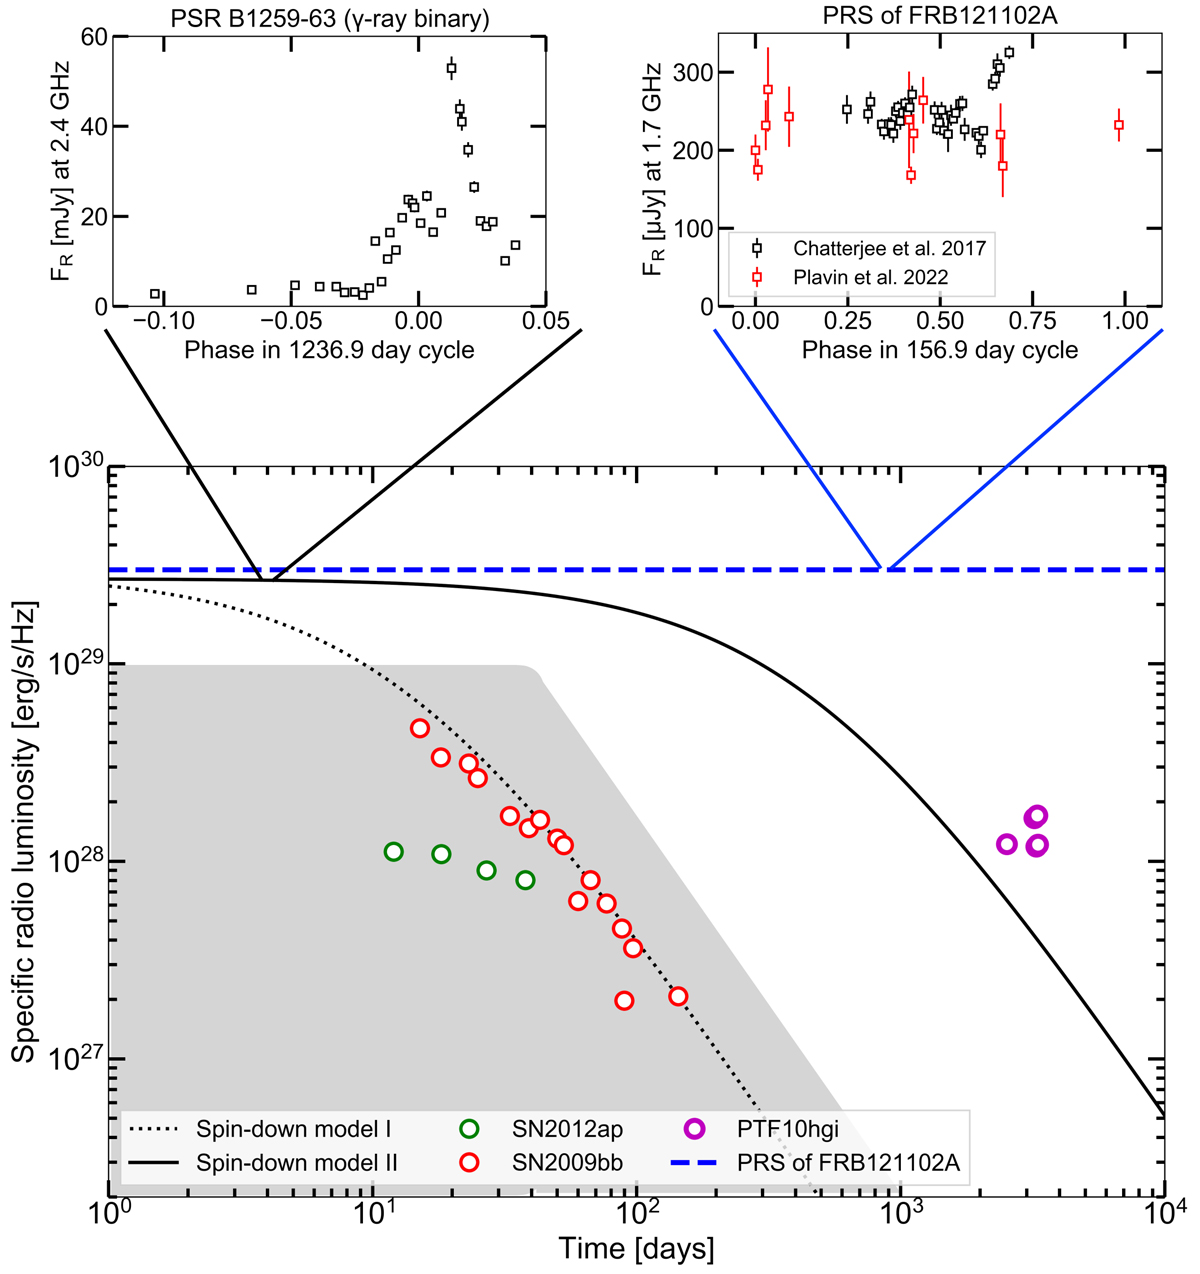
Fig. 7.
Download original image
Schematic overview of the time evolution of the radio luminosity of several discussed scenarios for the PRS. Note that the spin-down models represent the orbitally averaged luminosity and do not show the expected orbital modulation; this modulation is shown in the insets. The grey region indicates the typical region where type Ic supernovae are observed. See Sect. 4.3.3 for details.
Current usage metrics show cumulative count of Article Views (full-text article views including HTML views, PDF and ePub downloads, according to the available data) and Abstracts Views on Vision4Press platform.
Data correspond to usage on the plateform after 2015. The current usage metrics is available 48-96 hours after online publication and is updated daily on week days.
Initial download of the metrics may take a while.