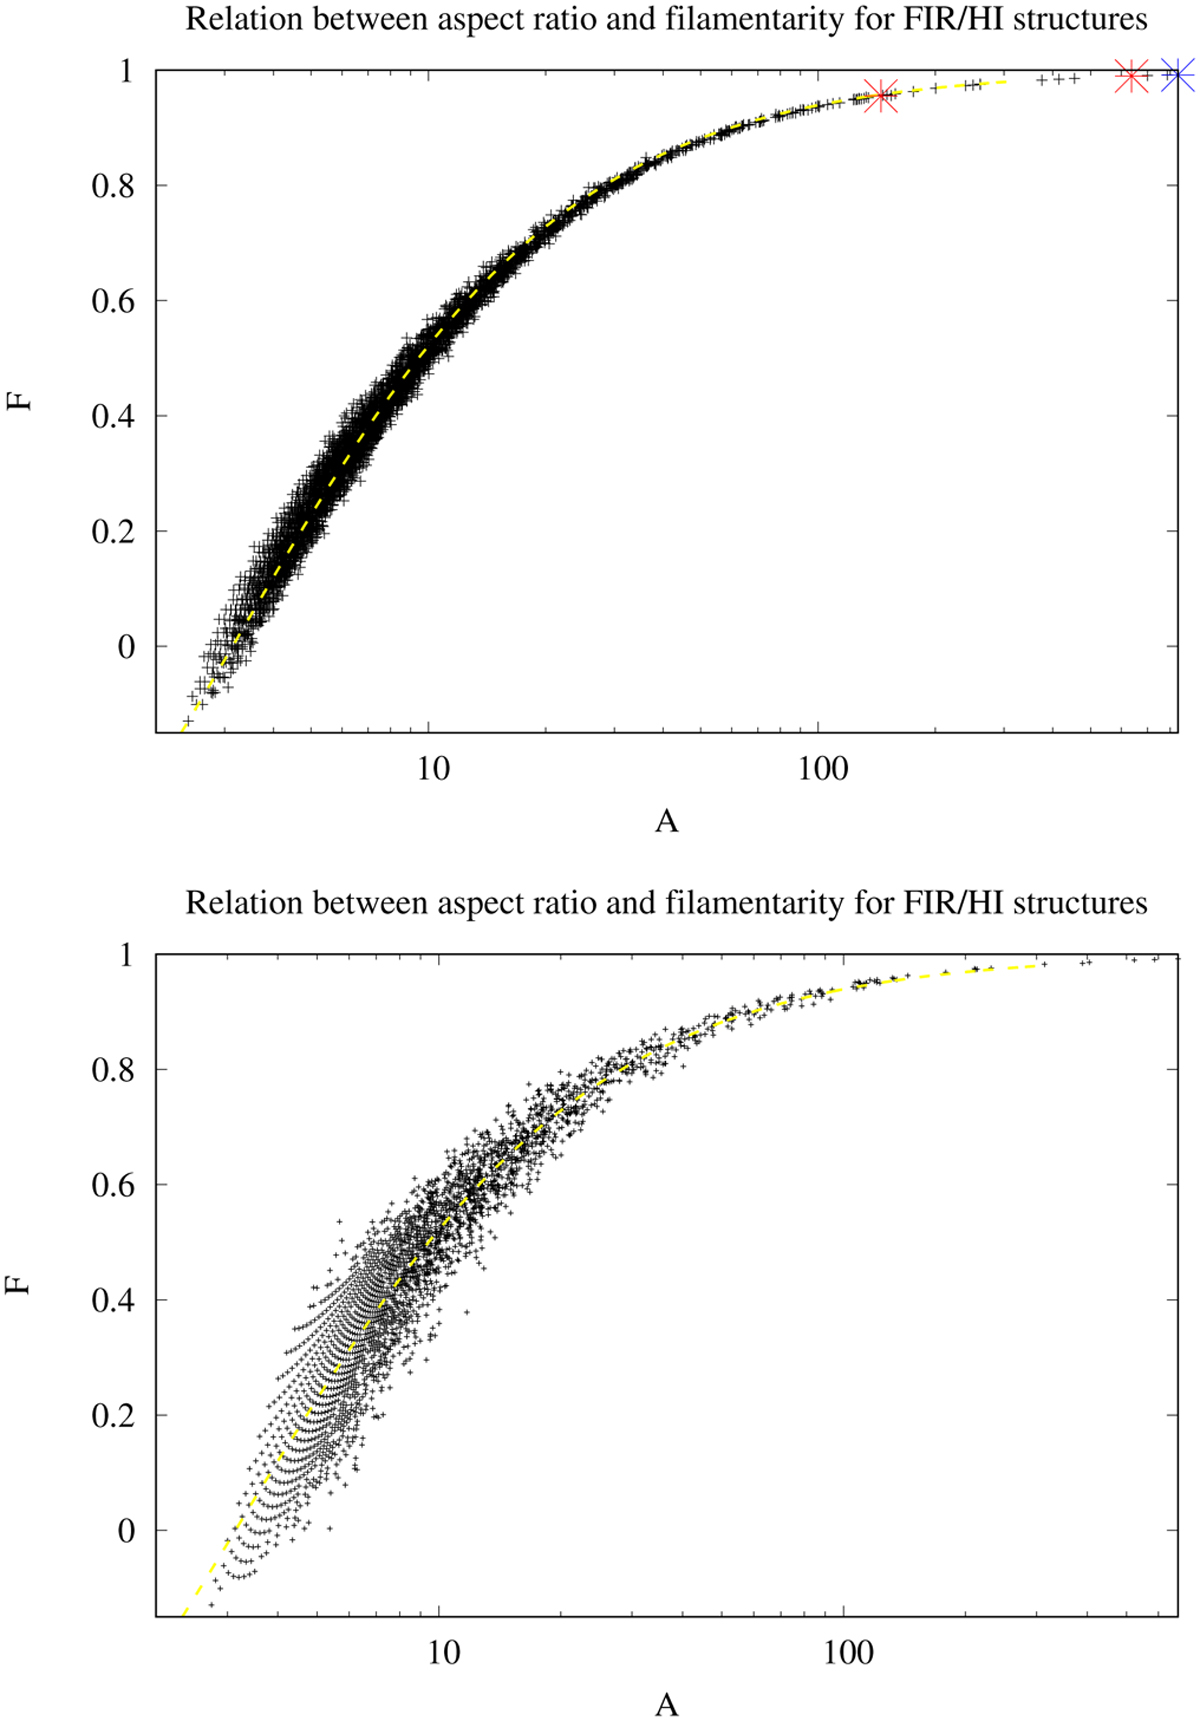
Fig. 9
Download original image
Distribution of filaments covering the parameter space in aspect ratio 𝒜 and filamentarity ℱ. The distribution in the top panel was derived using the width W as described in Sect. 2.2.2 for each filament. For the distribution in the bottom panel, we use widths as determined from the fit described in Sect. 3.2. The dashed yellow line is derived from Eq. (9) using aspect ratios according to Eq. (7). Positions marked in red in the upper plot belong to the two filaments described in Sect. 3.6; merging these filaments results in a single structure, marked with blue.
Current usage metrics show cumulative count of Article Views (full-text article views including HTML views, PDF and ePub downloads, according to the available data) and Abstracts Views on Vision4Press platform.
Data correspond to usage on the plateform after 2015. The current usage metrics is available 48-96 hours after online publication and is updated daily on week days.
Initial download of the metrics may take a while.