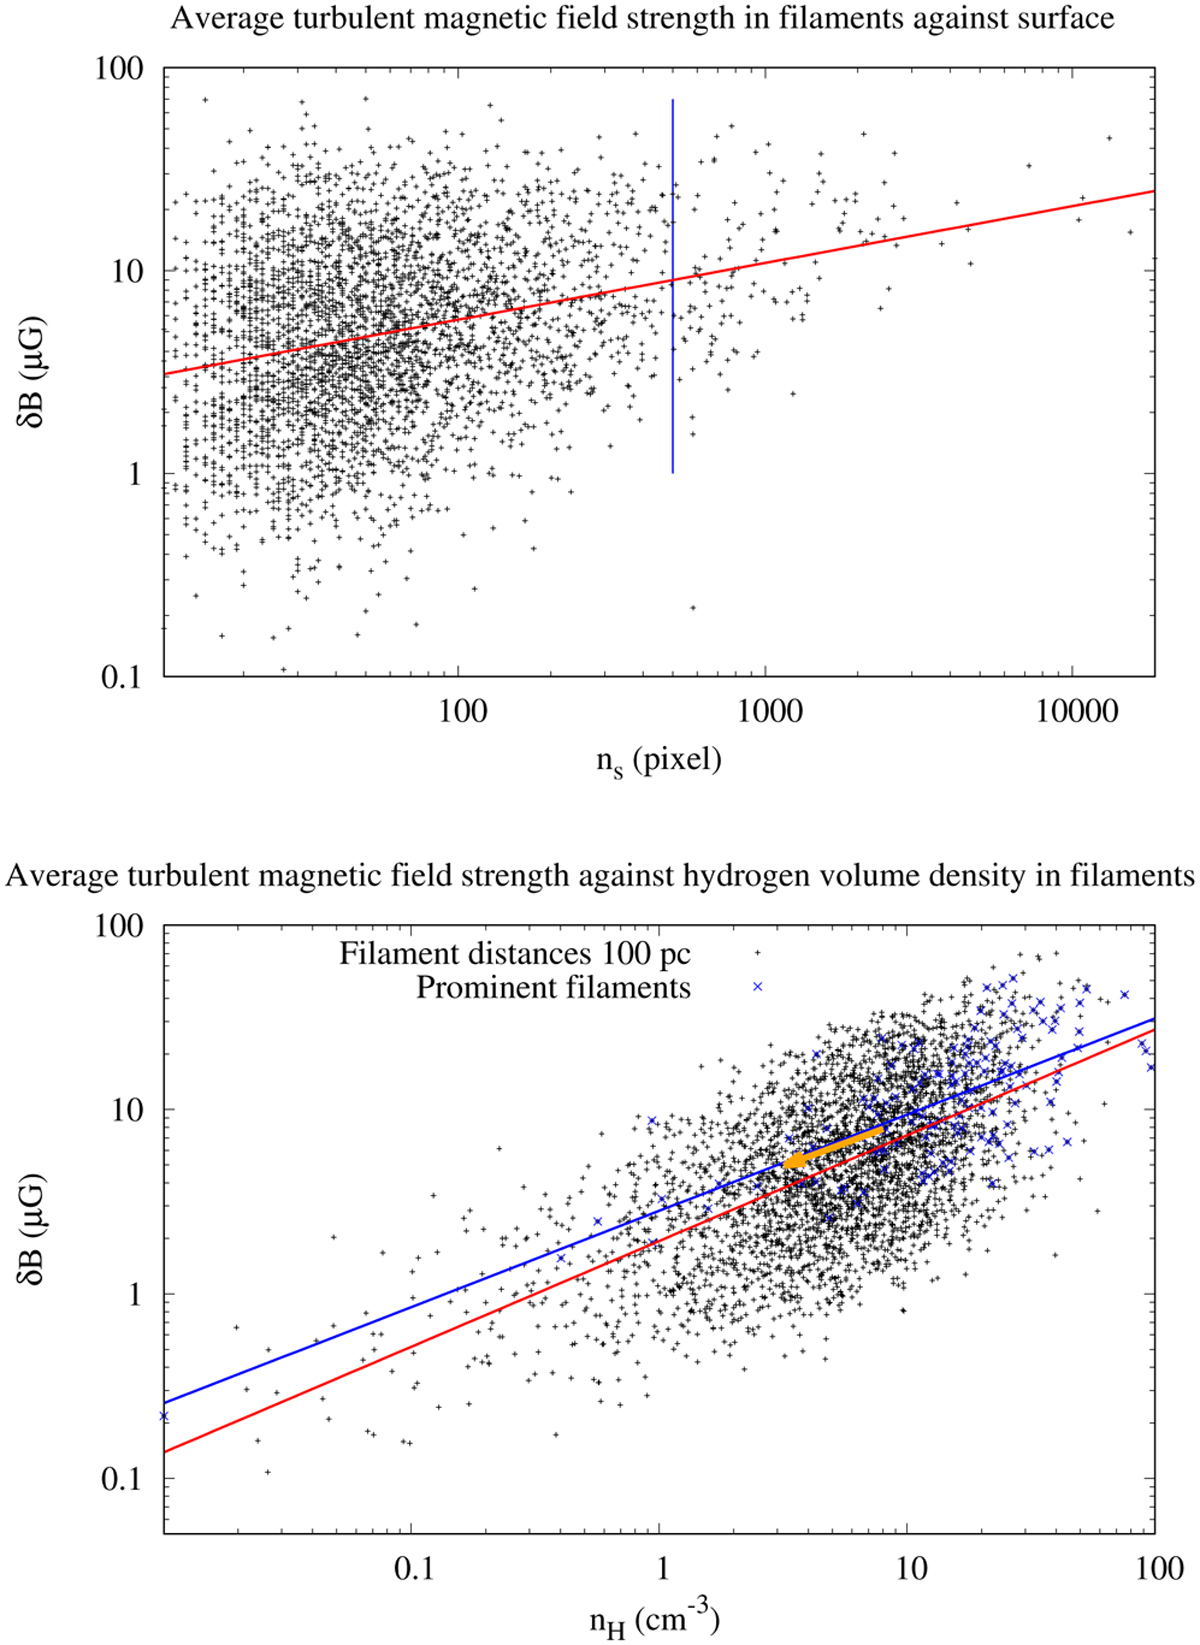
Fig. 23
Download original image
Average turbulent magnetic field strength δB in filaments. Top: δB depending on filament surface ns. The fit ln(δB) = 0.46 ± 0.07 + (0.28 ± 0.02)ln(ns) is indicated by the red line. Bottom: average turbulent magnetic field strength in filaments δB as a function of the average hydrogen volume density. The fit ln(δB) = 0.66 ± 0.02 + (0.57 ± 0.01) ln(nH) for all 6568 filaments is indicated in red. Fitting only prominent filaments with surfaces for ns > 500 (right from the vertical blue line in the top figure), we get ln(δB) = 1.0 ± 0.1 + (0.52 ± 0.04)ln(nH), as indicated by the blue line. The orange arrow points from the center of mass of the point cloud (〈nH〉 = 8.0 cm−3, 〈δB〉 = 7.9 μG) -assuming a distance of 100 pc – to the center of mass (〈nH〉 = 3.2 cm−3, 〈δB〉 = 5.0 μG) for a distance of 250 pc.
Current usage metrics show cumulative count of Article Views (full-text article views including HTML views, PDF and ePub downloads, according to the available data) and Abstracts Views on Vision4Press platform.
Data correspond to usage on the plateform after 2015. The current usage metrics is available 48-96 hours after online publication and is updated daily on week days.
Initial download of the metrics may take a while.