Fig. 15
Download original image
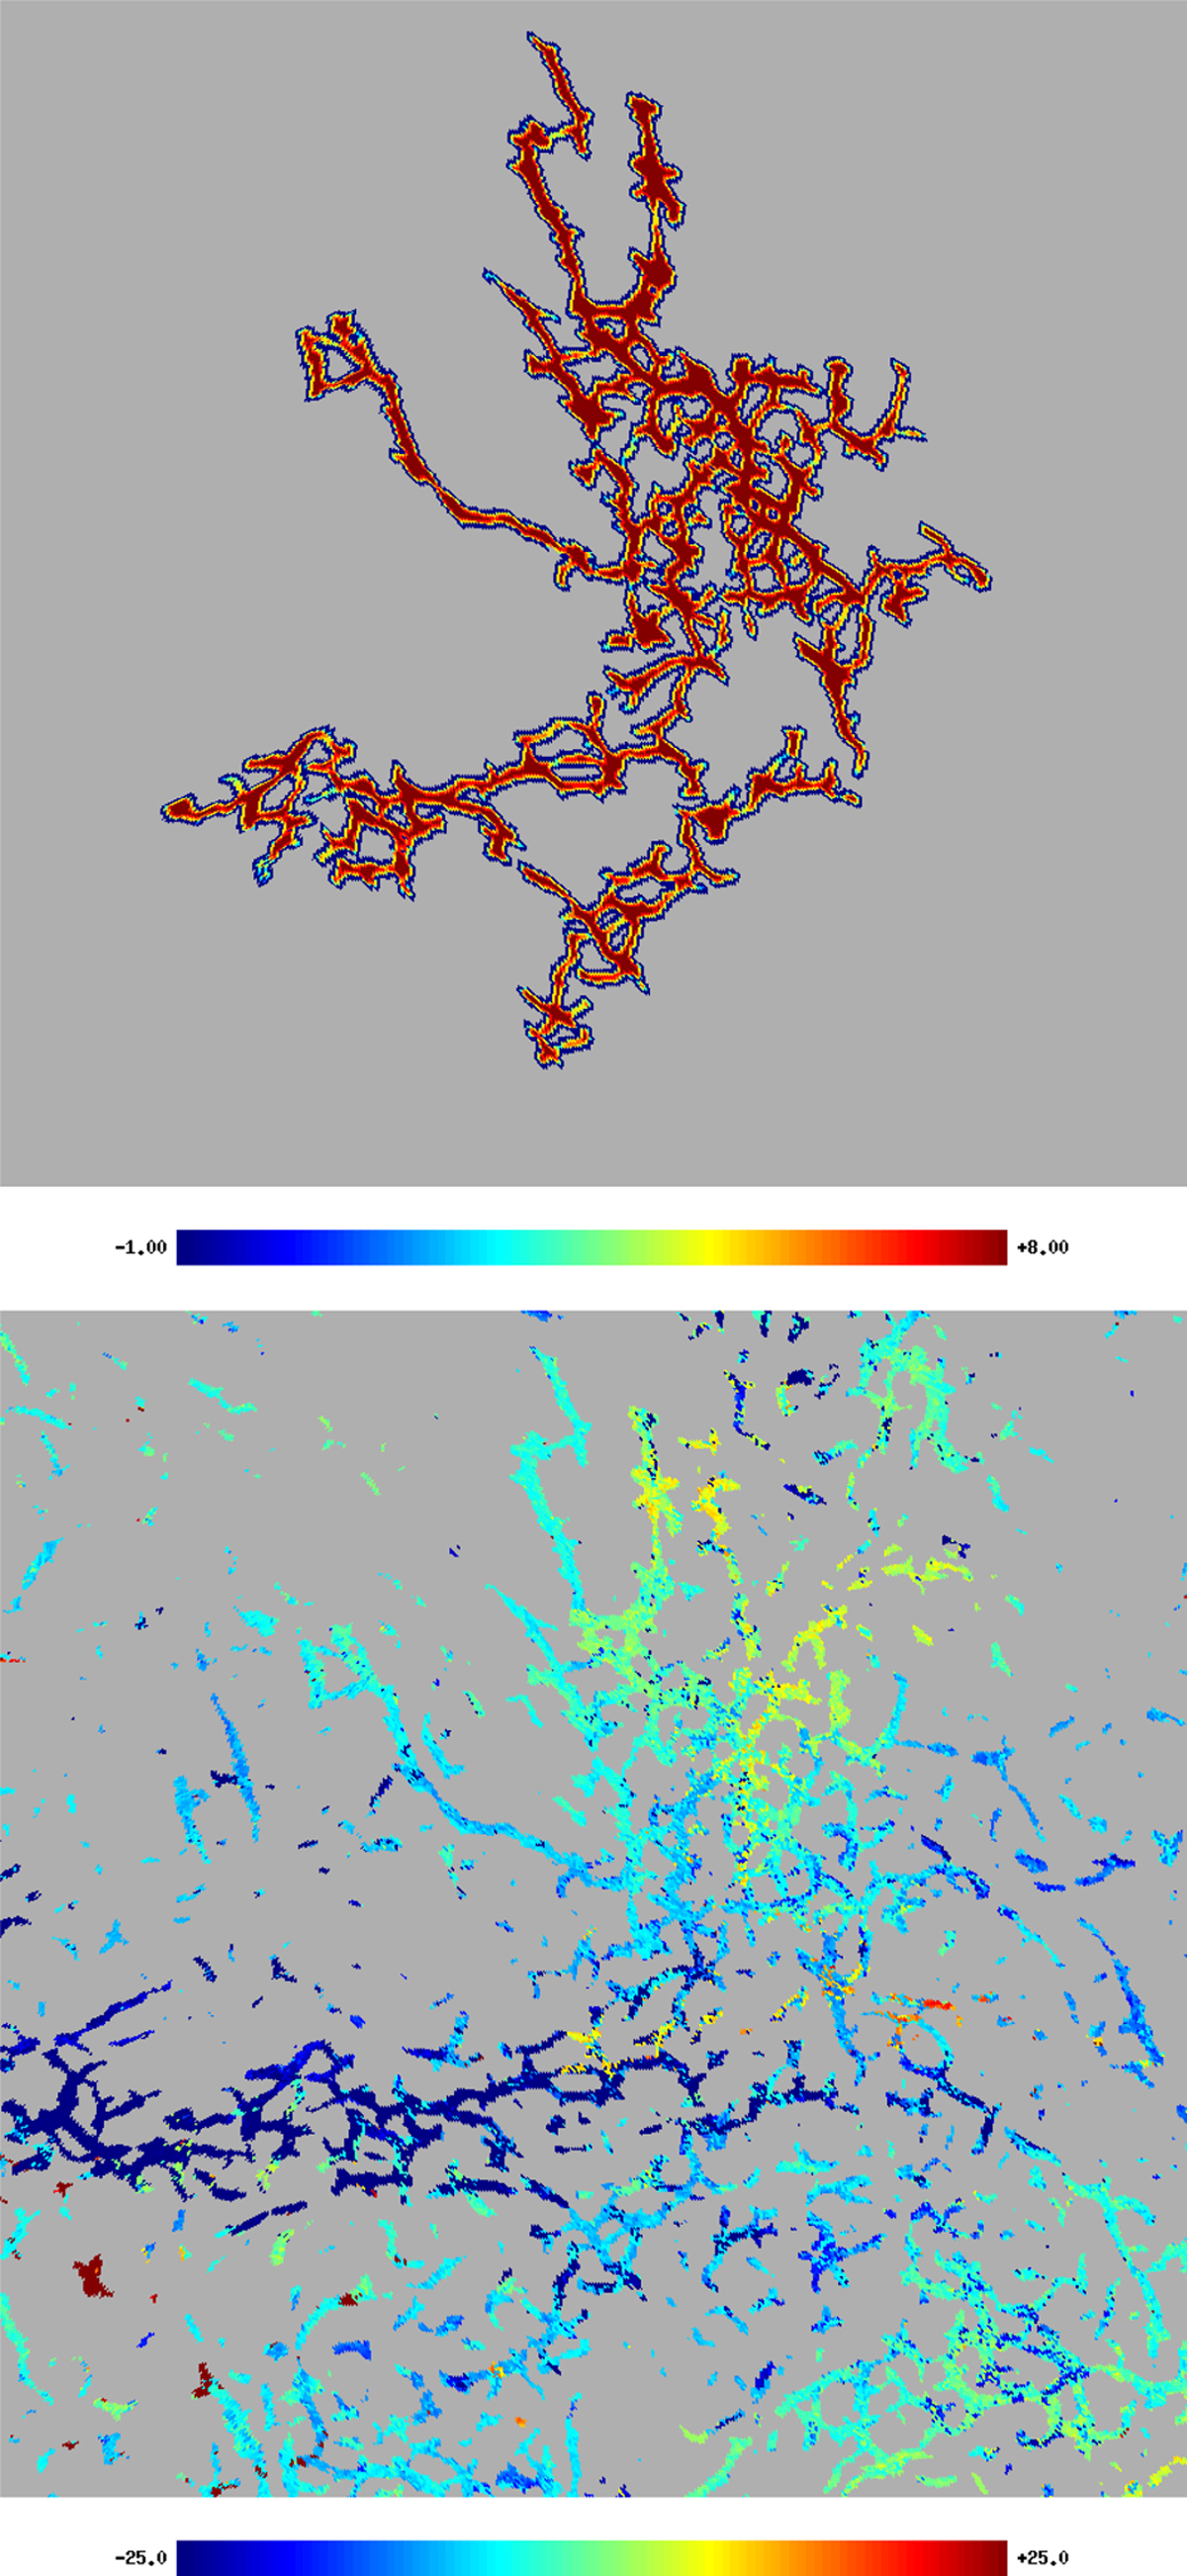
Spatial distribution of filamentary structures in gnomonic projection. The field size is 27°.7. Top: isolated filamentary structures discussed in the text. For each position, the color coding shows weights according to the number of neighbors nNeighbor inside the filament. Boundary pixels nPout just outside the filaments have weight −1 and are coded in blue. Bottom: velocity field of the filamentary structures, including all other filaments in the field. The center position is l = 260°, b = 58°.
Current usage metrics show cumulative count of Article Views (full-text article views including HTML views, PDF and ePub downloads, according to the available data) and Abstracts Views on Vision4Press platform.
Data correspond to usage on the plateform after 2015. The current usage metrics is available 48-96 hours after online publication and is updated daily on week days.
Initial download of the metrics may take a while.