Fig. 13
Download original image
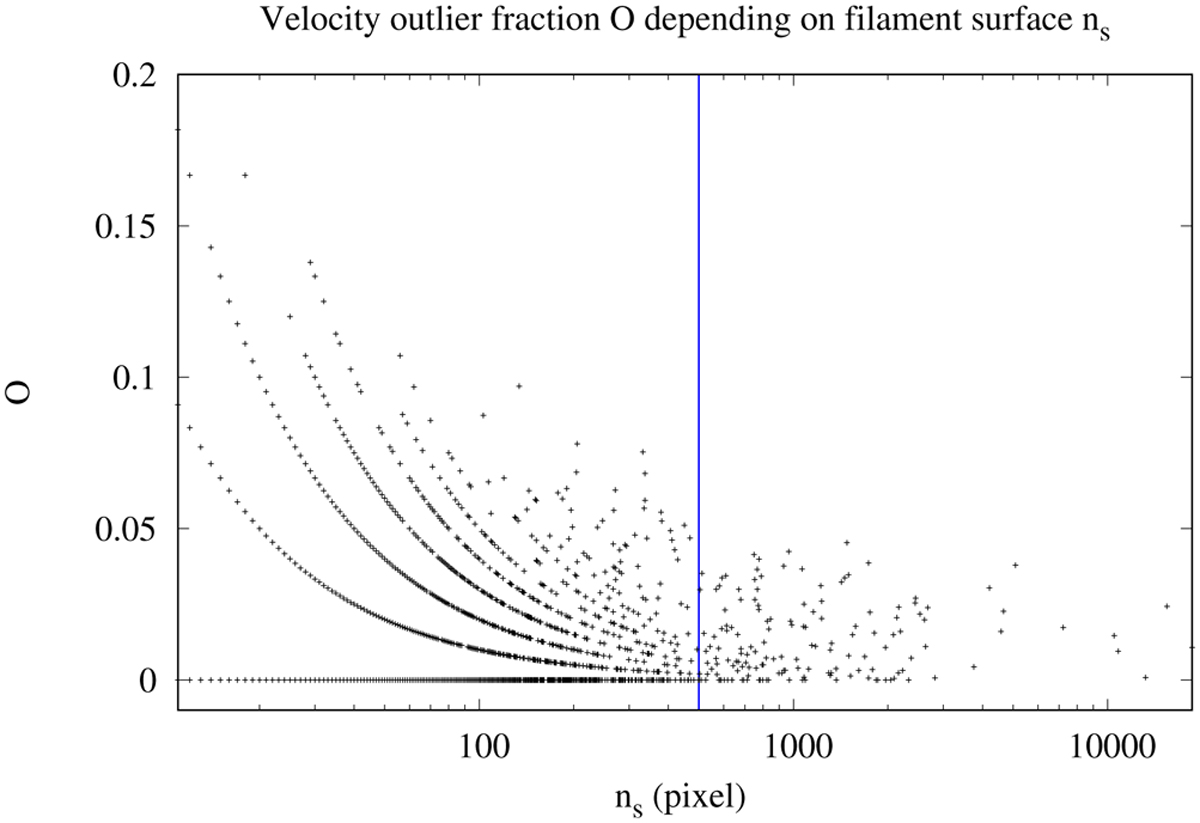
Fraction O of outlier positions depending on filament surface nS. Outliers are defined as positions with velocities deviating from the average filament velocity by more than three times the velocity dispersion. The presentation is strongly quantized, showing, from bottom to top, outlier counts of zero, one, two, and so on. The blue vertical line divides the sample at nS = 500.
Current usage metrics show cumulative count of Article Views (full-text article views including HTML views, PDF and ePub downloads, according to the available data) and Abstracts Views on Vision4Press platform.
Data correspond to usage on the plateform after 2015. The current usage metrics is available 48-96 hours after online publication and is updated daily on week days.
Initial download of the metrics may take a while.