Fig. 7
Download original image
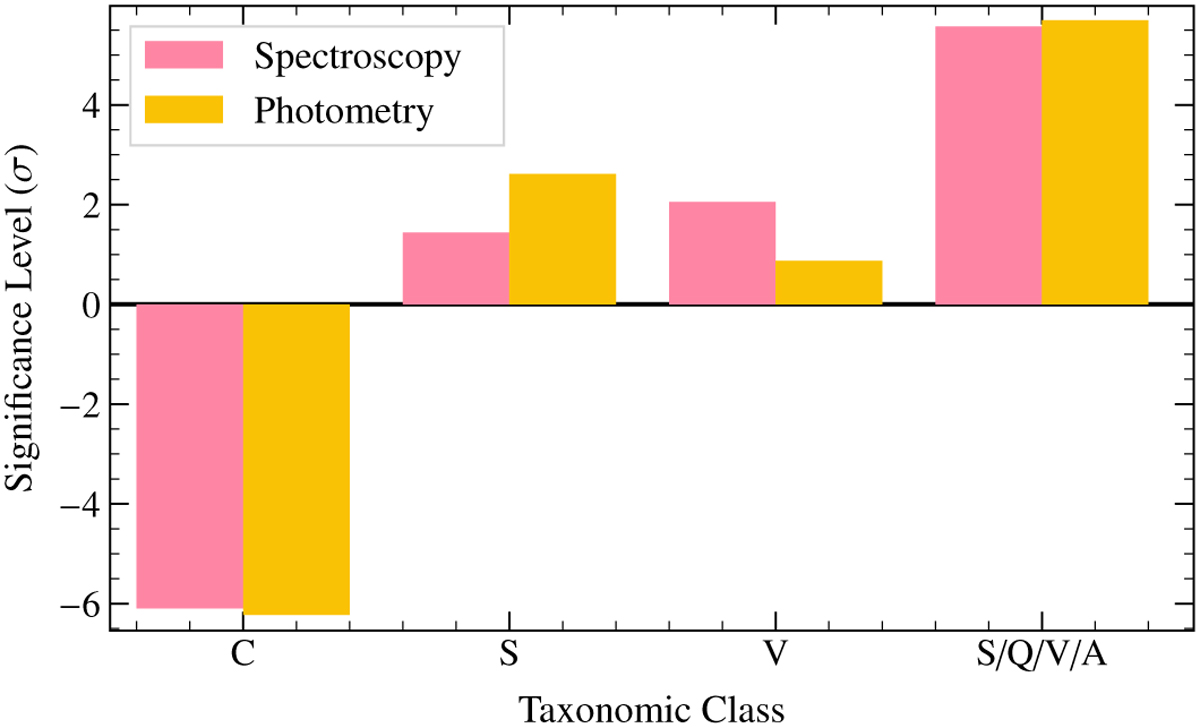
Number of standard deviations away from the background for selected reduced taxonomic classes, with a negative value representing classes with lower representation in the specified population than the background, and a positive value representing a higher representation in the specified population than the background. Classes are ordered from least to most thermally evolved moving from left to right, with the most substantial under-representation in the C complex, and the most substantial over-representation in the V class and S/Q/V/A complex.
Current usage metrics show cumulative count of Article Views (full-text article views including HTML views, PDF and ePub downloads, according to the available data) and Abstracts Views on Vision4Press platform.
Data correspond to usage on the plateform after 2015. The current usage metrics is available 48-96 hours after online publication and is updated daily on week days.
Initial download of the metrics may take a while.