Fig. 6.
Download original image
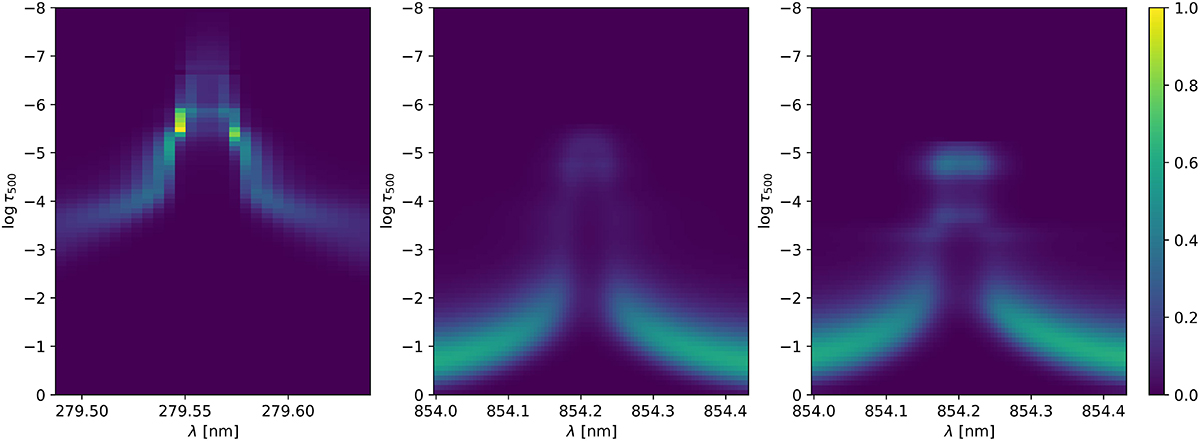
Response functions to variations in temperature. The left panel shows the average response function for the traced fibrils (see Sect. 4.2 and Fig. 8) for the Mg II k line, while the same is shown for the Ca II 854.2 nm line in the middle panel. The right panel shows the response function to temperature for the Ca II 854.2 nm for a representative pixel in a plage area, marked in panel (a) of Fig. 3. All panels have a common normalisation factor, which is set to the peak value of the response function for the Mg II k line in the first panel.
Current usage metrics show cumulative count of Article Views (full-text article views including HTML views, PDF and ePub downloads, according to the available data) and Abstracts Views on Vision4Press platform.
Data correspond to usage on the plateform after 2015. The current usage metrics is available 48-96 hours after online publication and is updated daily on week days.
Initial download of the metrics may take a while.