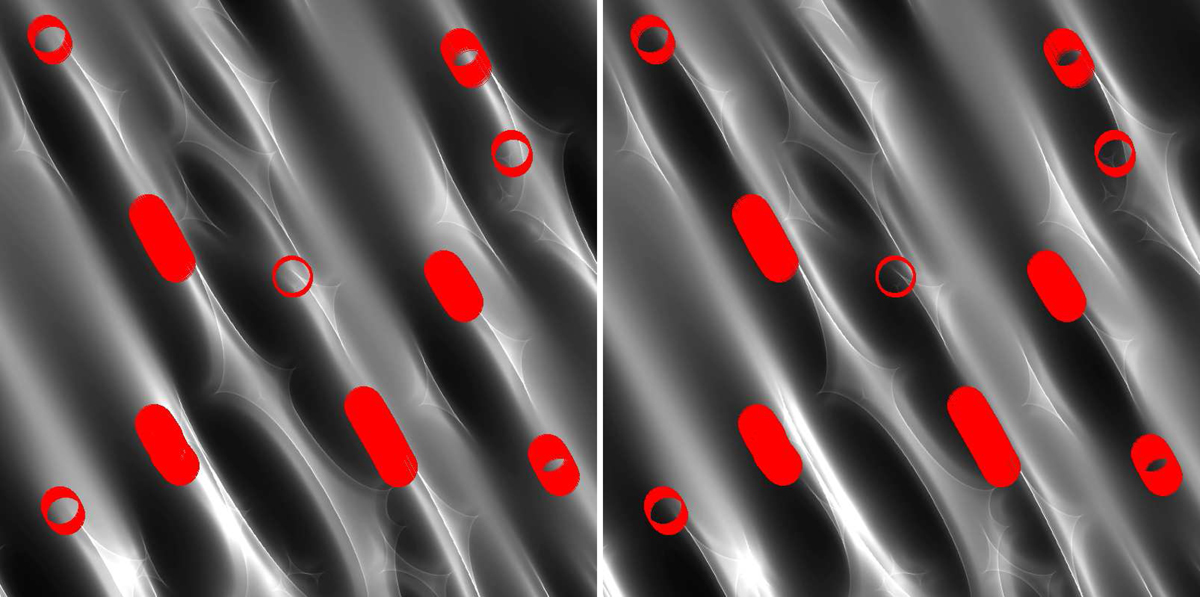
Fig. 8.
Download original image
Examples of positions on the magnification map where the computed line profile deformations fit the observed one with χ2/nd.o.f. ≤ 1.2 and where the computed indices match the observed ones within the error bars. The exact positions are at the center of the circles, the radius of which represents the BLR half-light radius r1/2 = 1.64 rin = 0.25 rE. The left panel shows the map convolved by the part of the BLR at the origin of the blue part of the line profile, while the right panel shows the map convolved by the part of the BLR at the origin of the red part of the line profile. The unconvolved magnification map is superimposed and seen as narrow caustics. The considered model is KD with i = 34°, q = 3, rin = 0.15 rE, and rs = 0.03 rE. The magnification map, computed with κ⋆/κ = 3%, is oriented at θ = 60°. The size of the illustrated part of the map is 8 rE × 8 rE. Similar patterns are observed throughout the full map, as well as for the EW model with θ ≤ 30°.
Current usage metrics show cumulative count of Article Views (full-text article views including HTML views, PDF and ePub downloads, according to the available data) and Abstracts Views on Vision4Press platform.
Data correspond to usage on the plateform after 2015. The current usage metrics is available 48-96 hours after online publication and is updated daily on week days.
Initial download of the metrics may take a while.