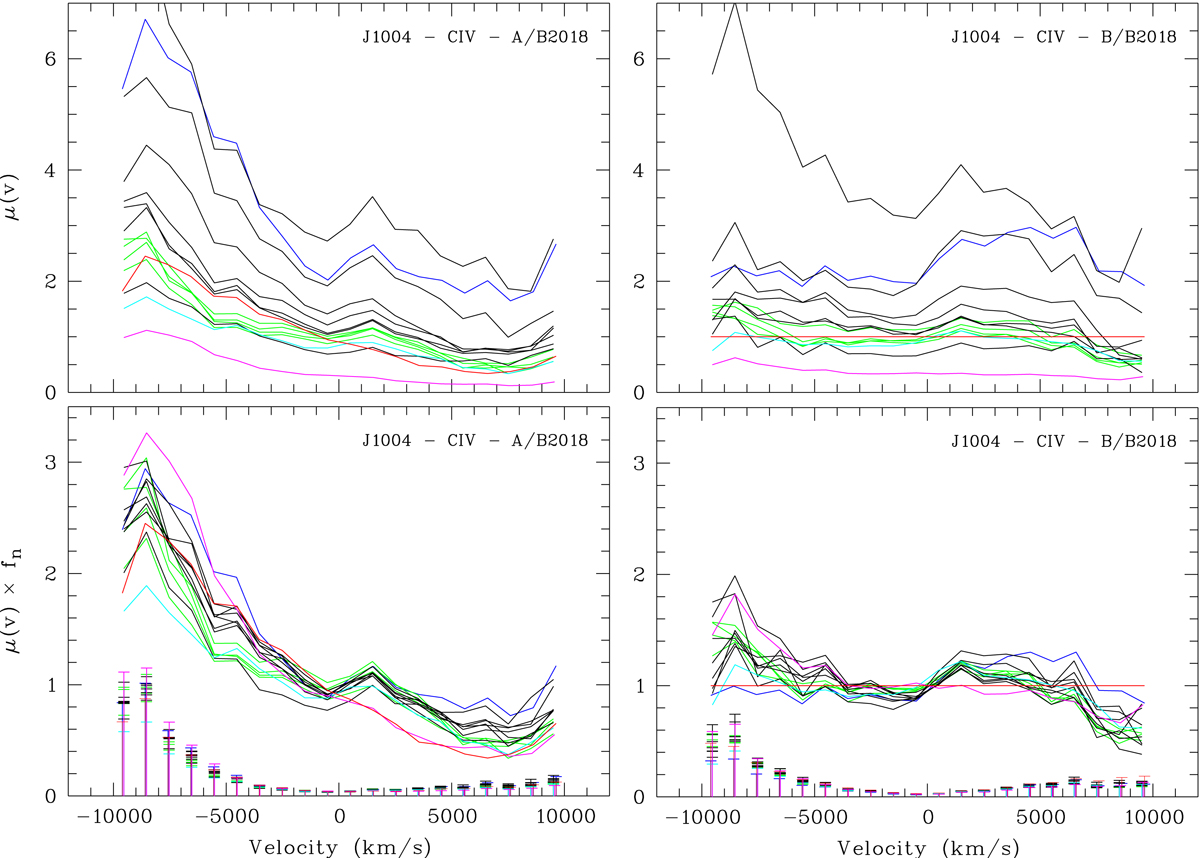
Fig. 6.
Download original image
Time series of μ(v) profiles of C IV computed from the spectra of images A and B with respect to the 2018 spectrum of image B, unaffected by microlensing (top). Same profiles are shown below, but normalized by the factor, fn, defined in the text. The color-coding of the profiles and the error bars are the same as in Fig. 4. The A/B2018 μ(v) profiles are not affected by microlensing in B, while the B/B2018 μ(v) profiles are not affected by microlensing in A. The normalized A/B2018 μ(v) profiles have similar shapes at the different epochs.
Current usage metrics show cumulative count of Article Views (full-text article views including HTML views, PDF and ePub downloads, according to the available data) and Abstracts Views on Vision4Press platform.
Data correspond to usage on the plateform after 2015. The current usage metrics is available 48-96 hours after online publication and is updated daily on week days.
Initial download of the metrics may take a while.