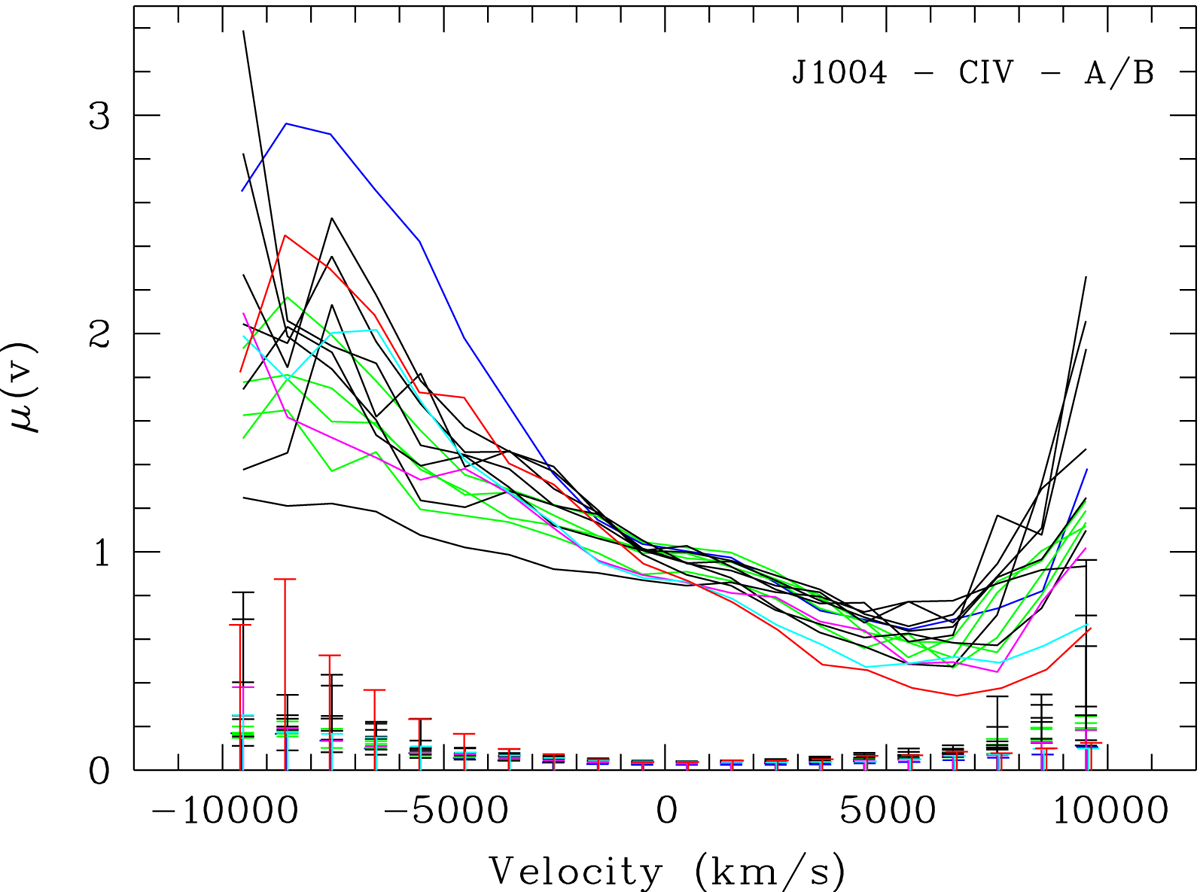
Fig. 4.
Download original image
Time series of μ(v) profiles of C IV computed from the spectra of images A and B obtained at the same epoch. Four epochs are emphasized: May 2003 (blue), May 2006 (cyan), October 2008 (magenta), and February 2018 (red); the other μ(v) profiles computed from spectra obtained in 2003 and 2004 are shown in green and black, respectively. The half error bars of μ(v) are drawn from zero for clarity.
Current usage metrics show cumulative count of Article Views (full-text article views including HTML views, PDF and ePub downloads, according to the available data) and Abstracts Views on Vision4Press platform.
Data correspond to usage on the plateform after 2015. The current usage metrics is available 48-96 hours after online publication and is updated daily on week days.
Initial download of the metrics may take a while.