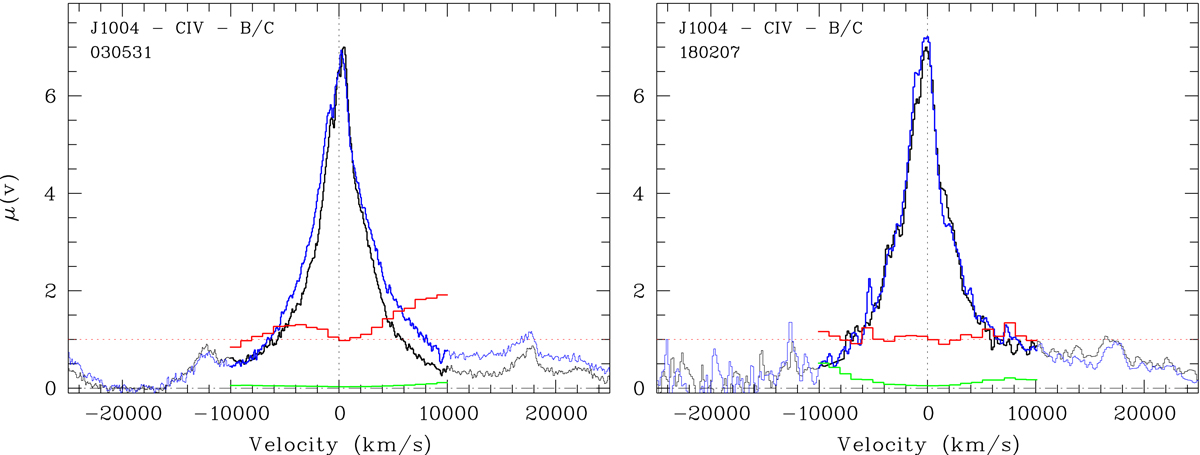
Fig. 3.
Download original image
μ(v) magnification profile of C IV (in red) computed from the spectra of images B and C obtained in May 2003 and February 2018, and binned into 20 spectral elements, as in Fig. 2. The line profiles from image B (in blue) and C (in black) are continuum-subtracted, corrected for the macro-magnification ratio and arbitrarily rescaled for convenience. The error of μ(v) is shown in green.
Current usage metrics show cumulative count of Article Views (full-text article views including HTML views, PDF and ePub downloads, according to the available data) and Abstracts Views on Vision4Press platform.
Data correspond to usage on the plateform after 2015. The current usage metrics is available 48-96 hours after online publication and is updated daily on week days.
Initial download of the metrics may take a while.