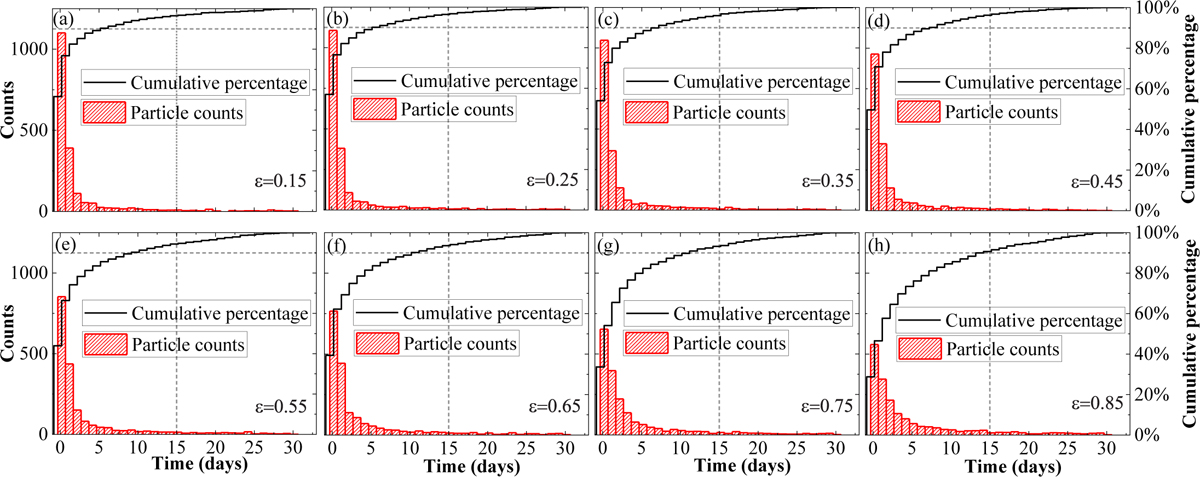
Fig. 9
Download original image
Time statistics of the particle with different coefficients of restitution entering the non-return orbits. The histograms show the distribution of the counts of particles entering the non-return orbits over the simulated time. The broken lines indicate the cumulative percentage of these particles. The green perpendicular dashed lines mark the moment of 15 days, and the horizontal dashed lines mark the 90% cumulative percentage.
Current usage metrics show cumulative count of Article Views (full-text article views including HTML views, PDF and ePub downloads, according to the available data) and Abstracts Views on Vision4Press platform.
Data correspond to usage on the plateform after 2015. The current usage metrics is available 48-96 hours after online publication and is updated daily on week days.
Initial download of the metrics may take a while.