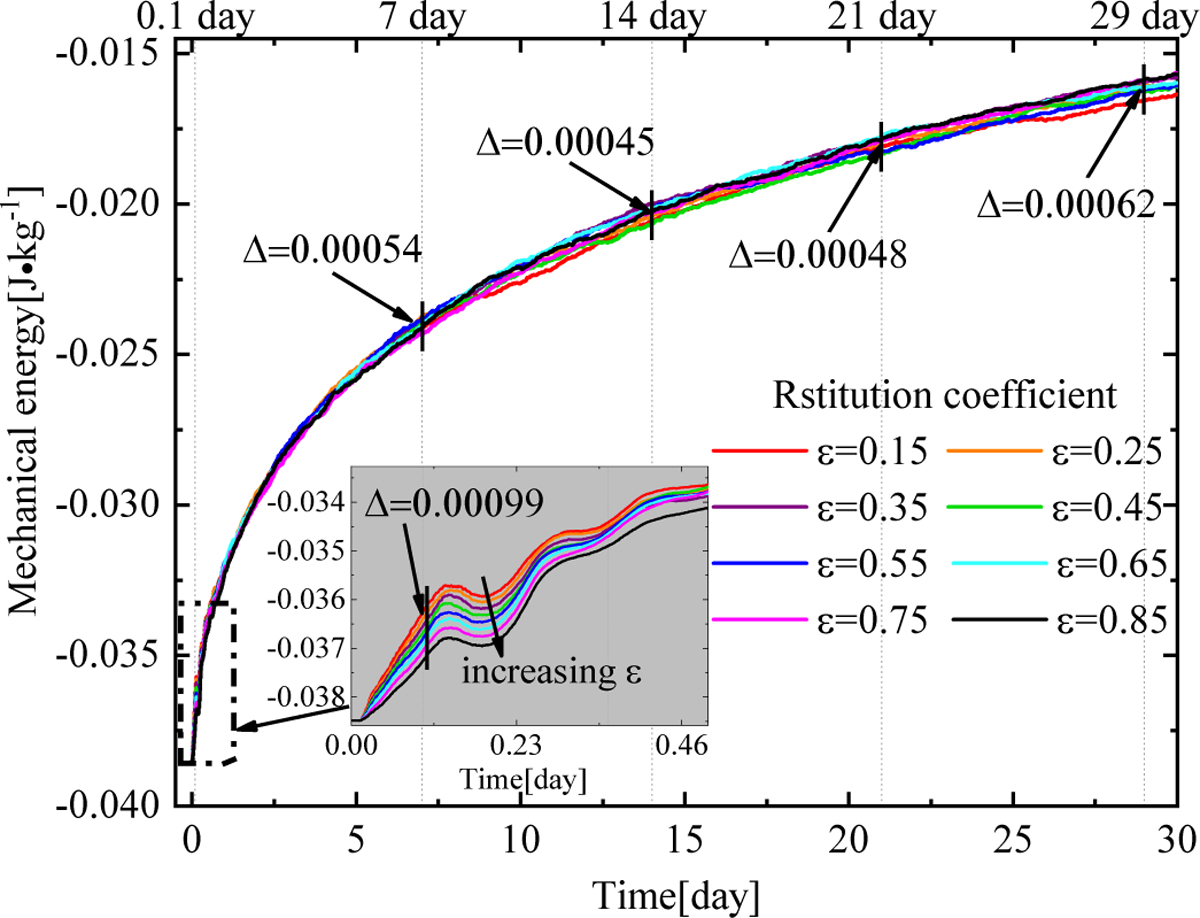
Fig. 6
Download original image
Evolution of the average mechanical energy of the particle cloud versus time within 30 days for eight groups of sample particles. The arrows indicate the difference of the mechanical energy at five different moments. The various curve colors represent the results of different coefficients of restitution and are coded as shown in the legend.
Current usage metrics show cumulative count of Article Views (full-text article views including HTML views, PDF and ePub downloads, according to the available data) and Abstracts Views on Vision4Press platform.
Data correspond to usage on the plateform after 2015. The current usage metrics is available 48-96 hours after online publication and is updated daily on week days.
Initial download of the metrics may take a while.