Fig. 3
Download original image
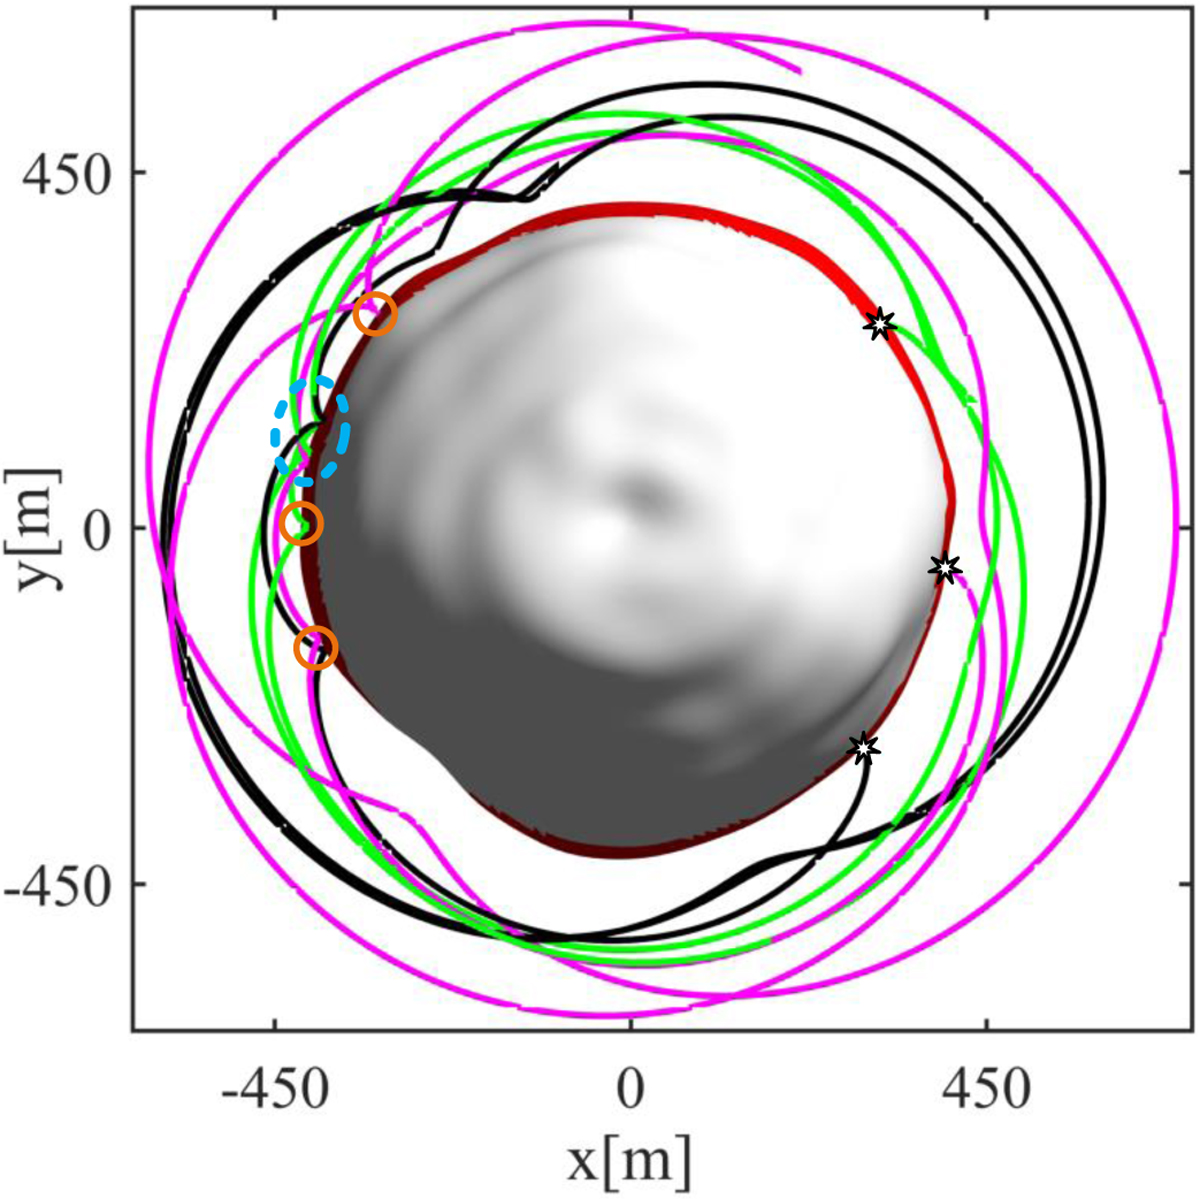
Saltation routes of three different shed particles. The solid lines of different colors respectively correspond to three different saltation routes whose launching positions are denoted by star-shaped marks. The orange circles indicate collision sites on the different saltation routes. The area surrounded by the blue dashed line denotes the unified destination of the three saltation routes.
Current usage metrics show cumulative count of Article Views (full-text article views including HTML views, PDF and ePub downloads, according to the available data) and Abstracts Views on Vision4Press platform.
Data correspond to usage on the plateform after 2015. The current usage metrics is available 48-96 hours after online publication and is updated daily on week days.
Initial download of the metrics may take a while.