Open Access
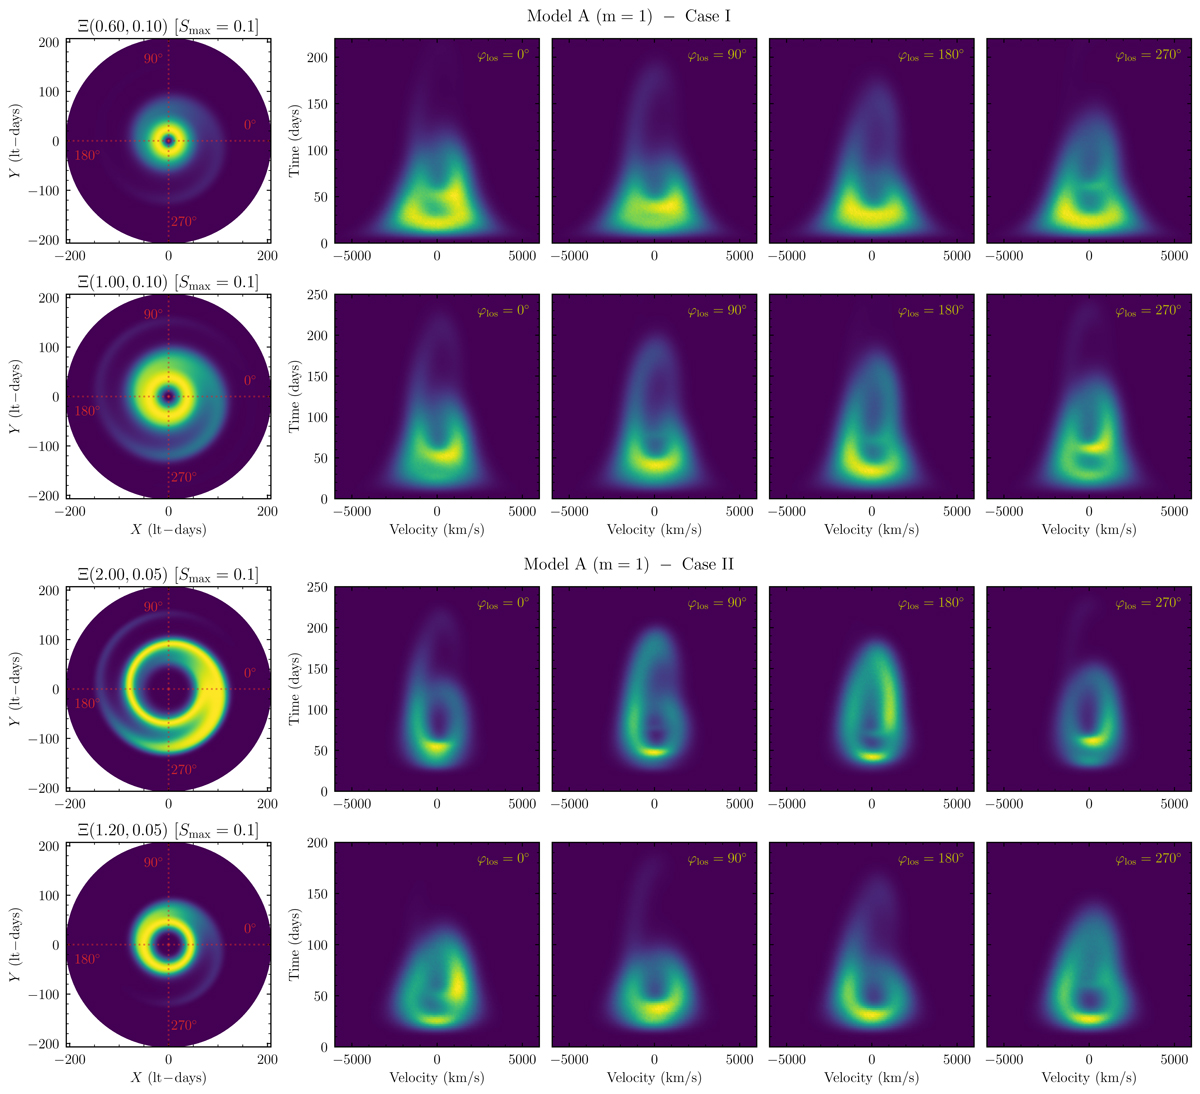
Fig. 6.
Download original image
Velocity-delay maps of Model A (m = 1) in Cases I and II. The left panel in each row is the Ξ image. The red dotted lines mark the LOS azimuthal angles φlos. The four panels on the right in each row are the velocity-delay maps corresponding to different φlos.
Current usage metrics show cumulative count of Article Views (full-text article views including HTML views, PDF and ePub downloads, according to the available data) and Abstracts Views on Vision4Press platform.
Data correspond to usage on the plateform after 2015. The current usage metrics is available 48-96 hours after online publication and is updated daily on week days.
Initial download of the metrics may take a while.