Fig. 4.
Download original image
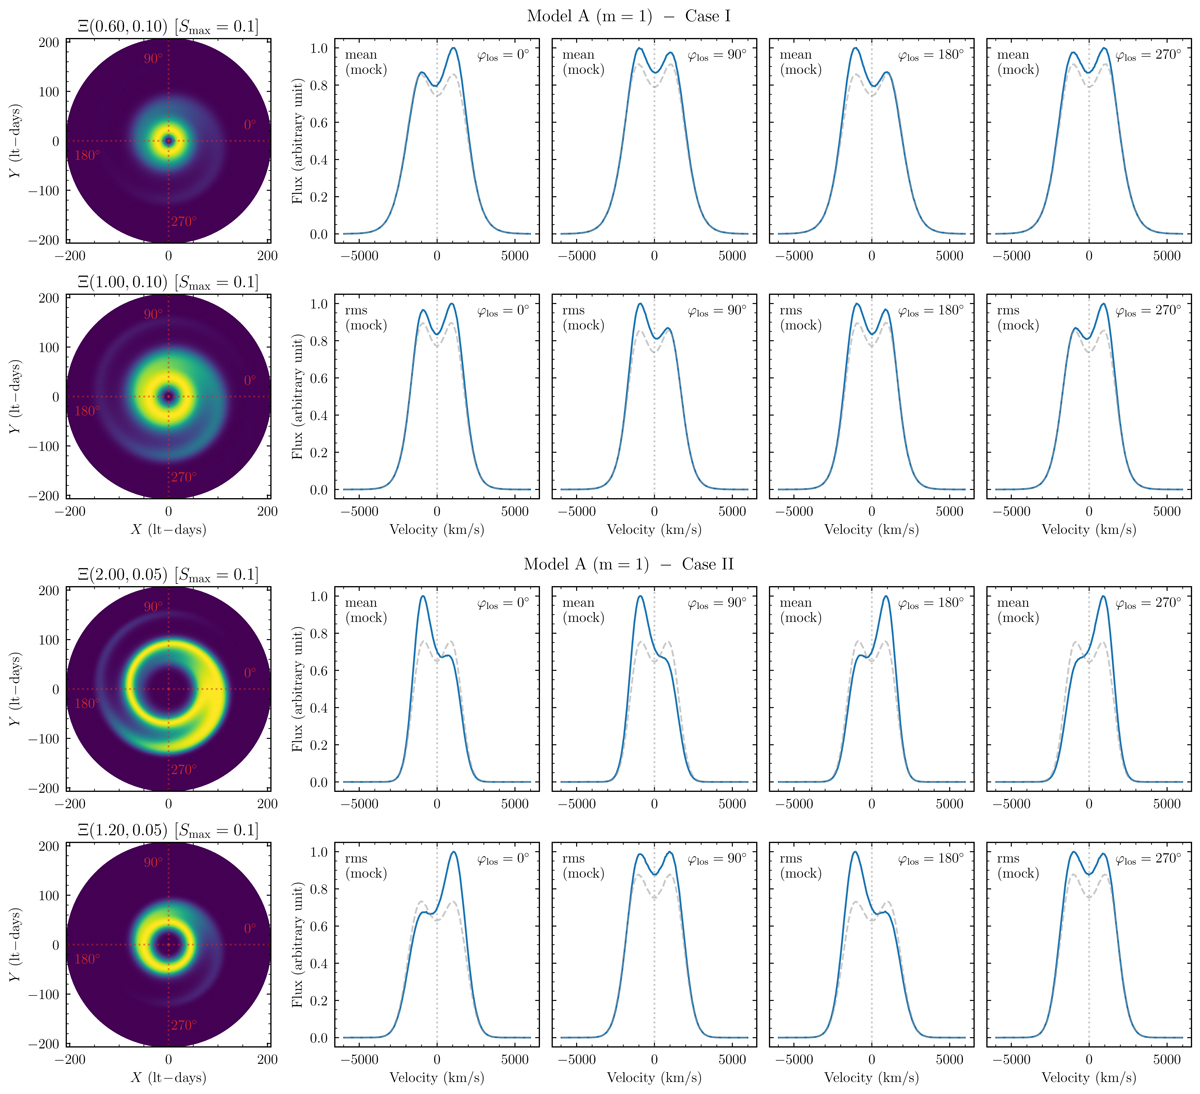
Emission-line profiles of Model A in Cases I and II. The left panel in each row is the Ξ image. The values of (μU, ![]() ) and Smax are marked on the top of the Ξ images. The red dotted lines mark the LOS azimuthal angles φlos. The four panels on the right in each row are the line profiles (blue solid lines) corresponding to different φlos. The gray dashed lines are the profiles without spiral arms. The line profiles (mock mean and rms) of the spiral arms for Case I are provided in the upper two rows, and the profiles of Case II are shown in the lower rows.
) and Smax are marked on the top of the Ξ images. The red dotted lines mark the LOS azimuthal angles φlos. The four panels on the right in each row are the line profiles (blue solid lines) corresponding to different φlos. The gray dashed lines are the profiles without spiral arms. The line profiles (mock mean and rms) of the spiral arms for Case I are provided in the upper two rows, and the profiles of Case II are shown in the lower rows.
Current usage metrics show cumulative count of Article Views (full-text article views including HTML views, PDF and ePub downloads, according to the available data) and Abstracts Views on Vision4Press platform.
Data correspond to usage on the plateform after 2015. The current usage metrics is available 48-96 hours after online publication and is updated daily on week days.
Initial download of the metrics may take a while.