Fig. 11.
Download original image
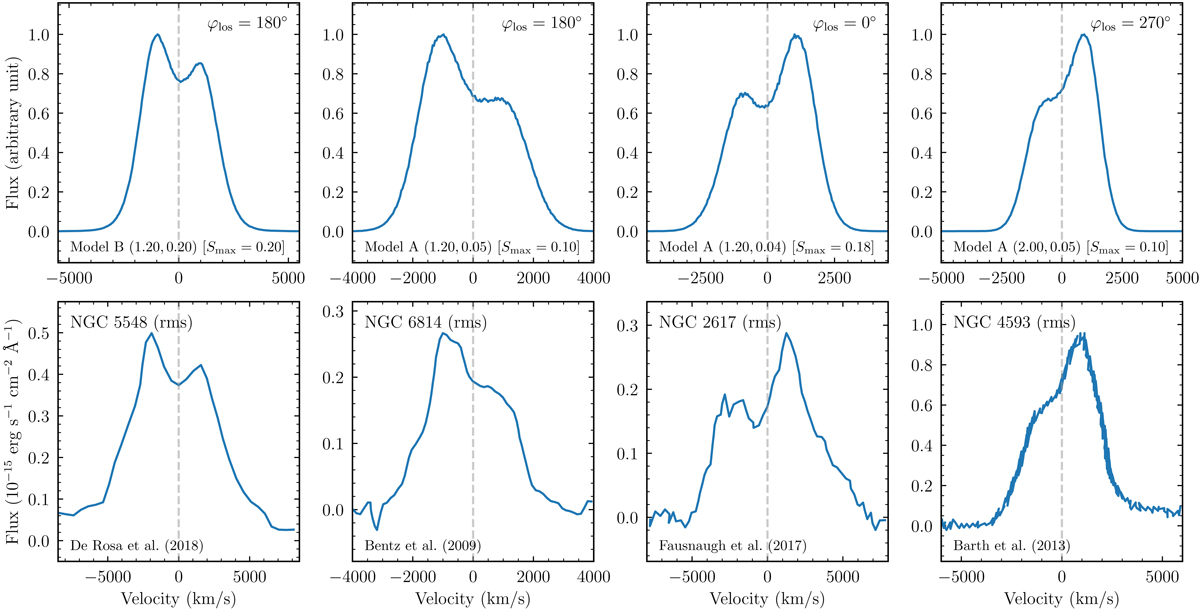
Some examples of the comparisons between the emission-line profiles generated from the models and observed in RM campaigns. The upper panels are the models, and the lower are the observed rms spectra extracted directly from the references marked in the lower left corners. The models, the parameters (μU, ![]() , and Smax), and the LOS azimuthal angles are marked in the lower left and upper right corners in the upper panels. The names of the objects are provided in the lower panels.
, and Smax), and the LOS azimuthal angles are marked in the lower left and upper right corners in the upper panels. The names of the objects are provided in the lower panels.
Current usage metrics show cumulative count of Article Views (full-text article views including HTML views, PDF and ePub downloads, according to the available data) and Abstracts Views on Vision4Press platform.
Data correspond to usage on the plateform after 2015. The current usage metrics is available 48-96 hours after online publication and is updated daily on week days.
Initial download of the metrics may take a while.