Fig. 3.
Download original image
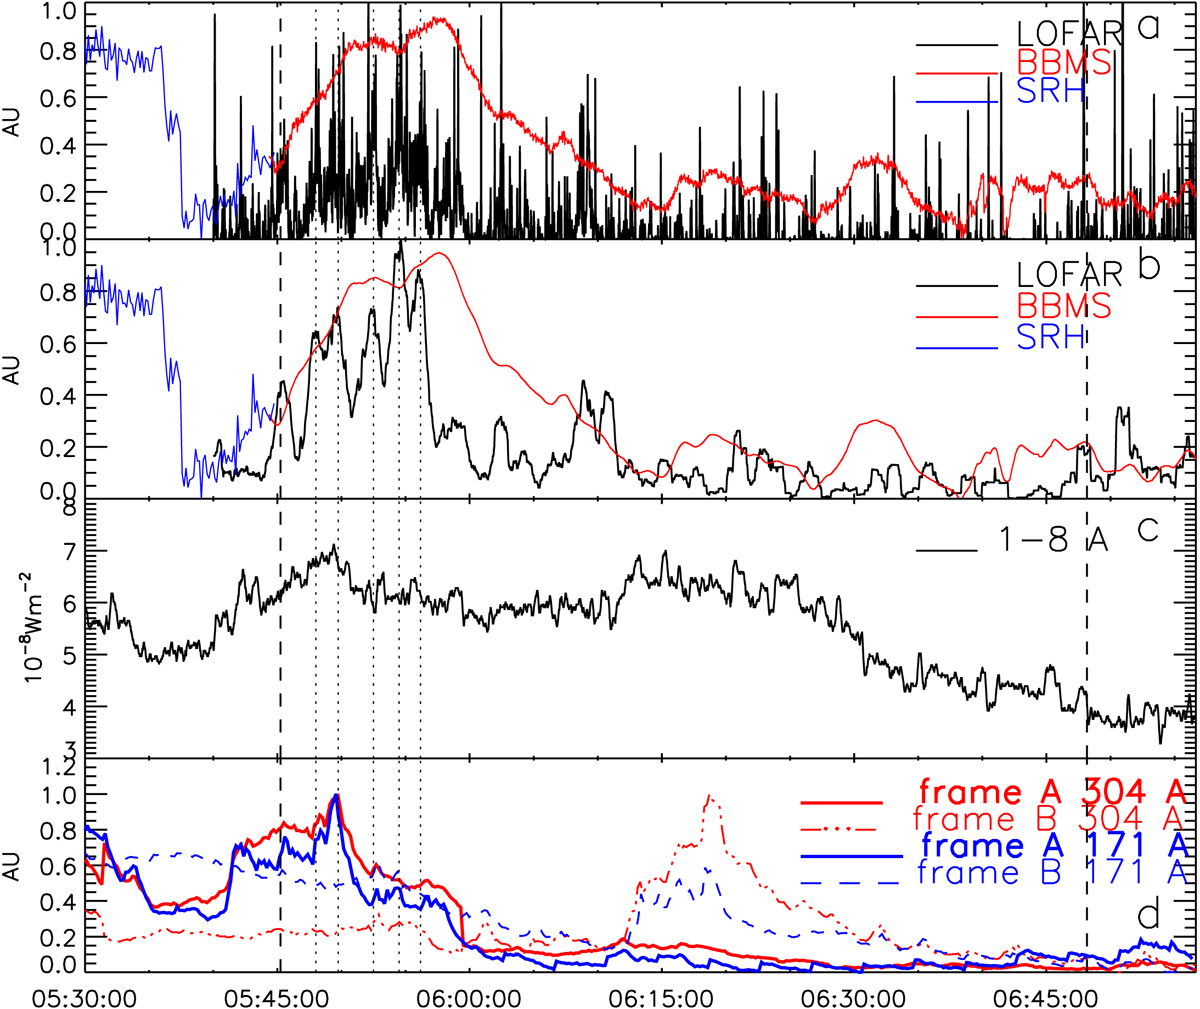
Profiles for time interval (bounded by vertical dashed lines) for which the cross-correlation coefficient between meter and microwave emission reaches 0.72. (a) Flux at 6 GHz (normalized, red curve) and time dependence of the meter flux, integrated over the frequency range 71 ± 0.5 MHz (black solid line). Before 05:45:15 the SRH correlation (blue curve) is shown. (b) Same, but for the meter flux, integrated over frequency range 53−80 MHz (black solid line). The 1 min smoothing window is used. (c) 1−8 Å GOES channel (solid curve), smoothing with 10 s window. (d) 304 Å profile (red solid line) and 171 Å profile (blue solid line) of the emissions summed over the pink frame and over the green frame (dash-dotted and dashed lines) in Fig. 5b.
Current usage metrics show cumulative count of Article Views (full-text article views including HTML views, PDF and ePub downloads, according to the available data) and Abstracts Views on Vision4Press platform.
Data correspond to usage on the plateform after 2015. The current usage metrics is available 48-96 hours after online publication and is updated daily on week days.
Initial download of the metrics may take a while.