Open Access
Fig. 1.
Download original image
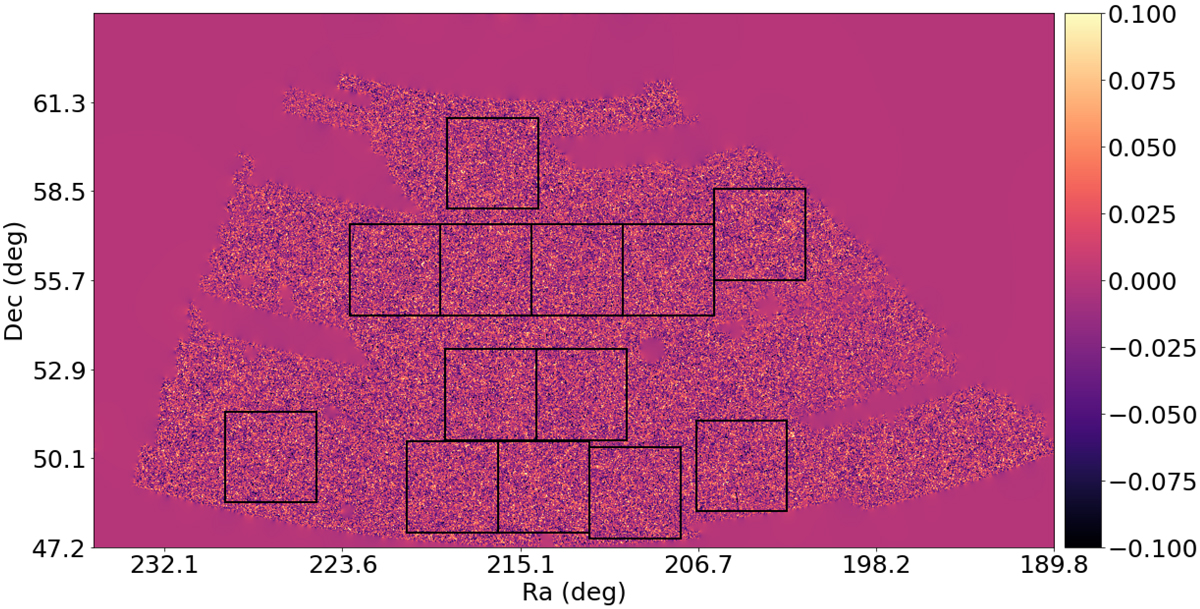
Convergence map of the CFIS-P3 patch. The squares indicate the regions free of large masks, which were used to compute the peak count. The total peak count is the mean of the peaks over the 13 patches.
Current usage metrics show cumulative count of Article Views (full-text article views including HTML views, PDF and ePub downloads, according to the available data) and Abstracts Views on Vision4Press platform.
Data correspond to usage on the plateform after 2015. The current usage metrics is available 48-96 hours after online publication and is updated daily on week days.
Initial download of the metrics may take a while.