Fig. 6
Download original image
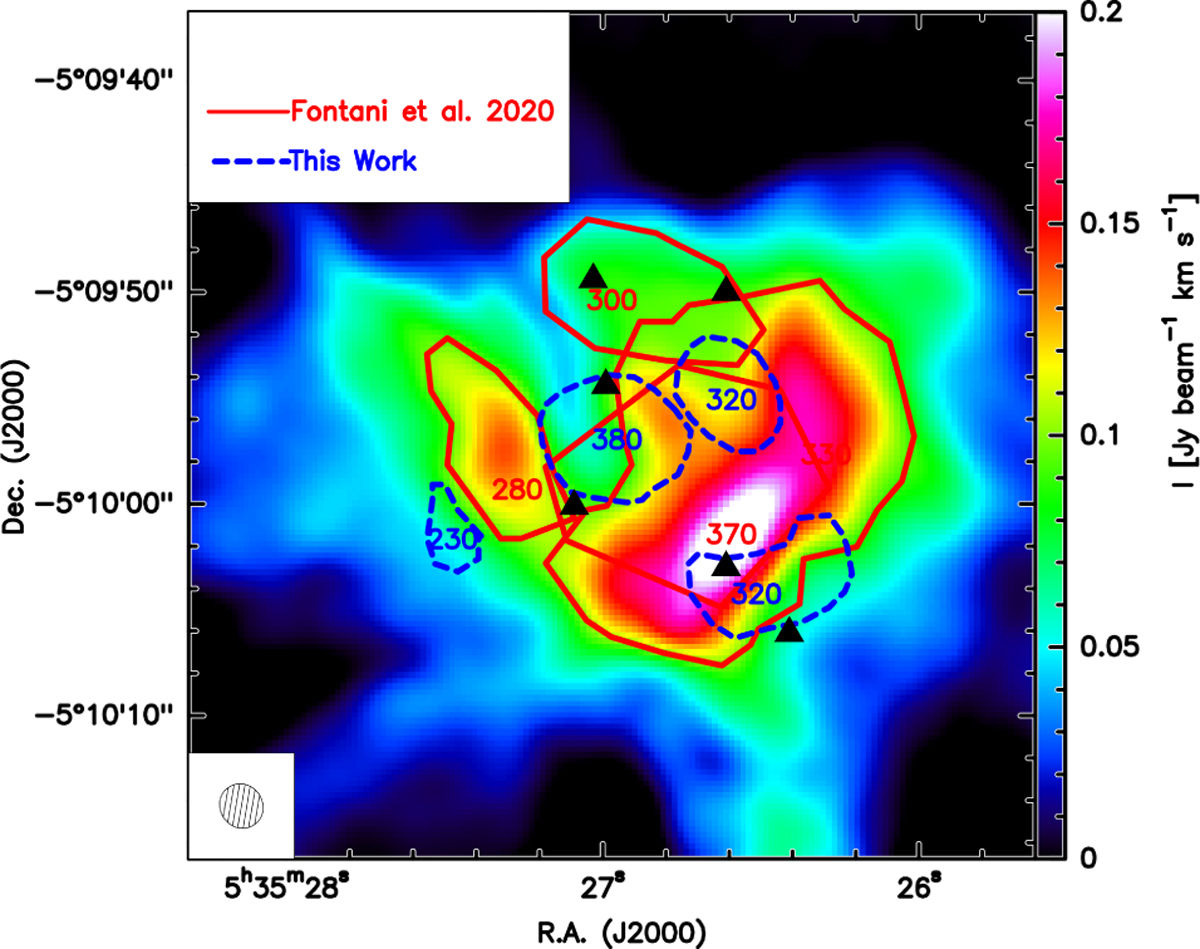
Combined 14N/15 N ratios in N2H+ in regions defined by Fontani et al. (2020) (red) and in regions defined by our work (blue) overlaid onto N2H+ (1–0) emission from Fontani et al. (2020) (colour scale), with the blue values representing the average of those presented in Table 5; red triangles show locations of continuum emission sources in FIR4 as identified by Neri et al. (in prep.). The wedge on the right indicates the range of flux density (Jy beam−1). The ellipse in the bottom-left corner represents the ALMA synthesised beam.
Current usage metrics show cumulative count of Article Views (full-text article views including HTML views, PDF and ePub downloads, according to the available data) and Abstracts Views on Vision4Press platform.
Data correspond to usage on the plateform after 2015. The current usage metrics is available 48-96 hours after online publication and is updated daily on week days.
Initial download of the metrics may take a while.