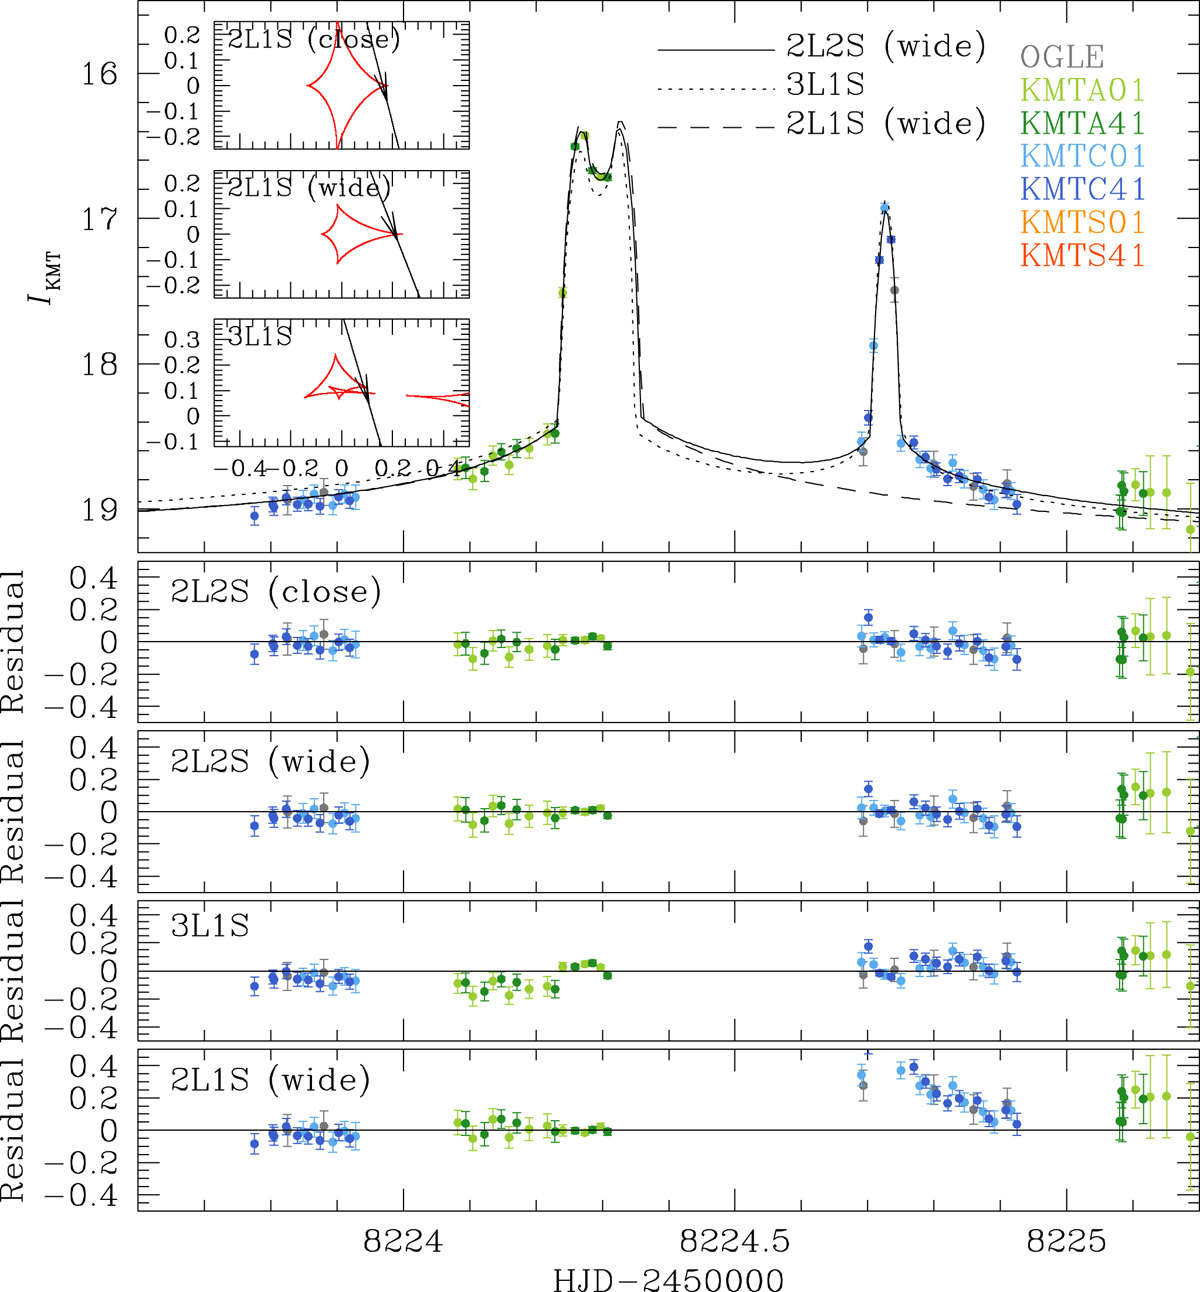
Fig. 2.
Download original image
Comparisons of models in anomaly region of OGLE-2018-BLG-0584 light curve. The top panel shows the four models of the close and wide 2L2S, 3L1S, and 2L1S solutions, and the lower panels show the residuals from the individual models. The three insets in the top panel show the lens system configurations of the 2L1S and 3L1S solutions. In each inset, the red figures represent the caustics and the line with an arrow indicates the source trajectory. The configuration of the 2L2S solutions are presented in Fig. 3.
Current usage metrics show cumulative count of Article Views (full-text article views including HTML views, PDF and ePub downloads, according to the available data) and Abstracts Views on Vision4Press platform.
Data correspond to usage on the plateform after 2015. The current usage metrics is available 48-96 hours after online publication and is updated daily on week days.
Initial download of the metrics may take a while.