Fig. 6
Download original image
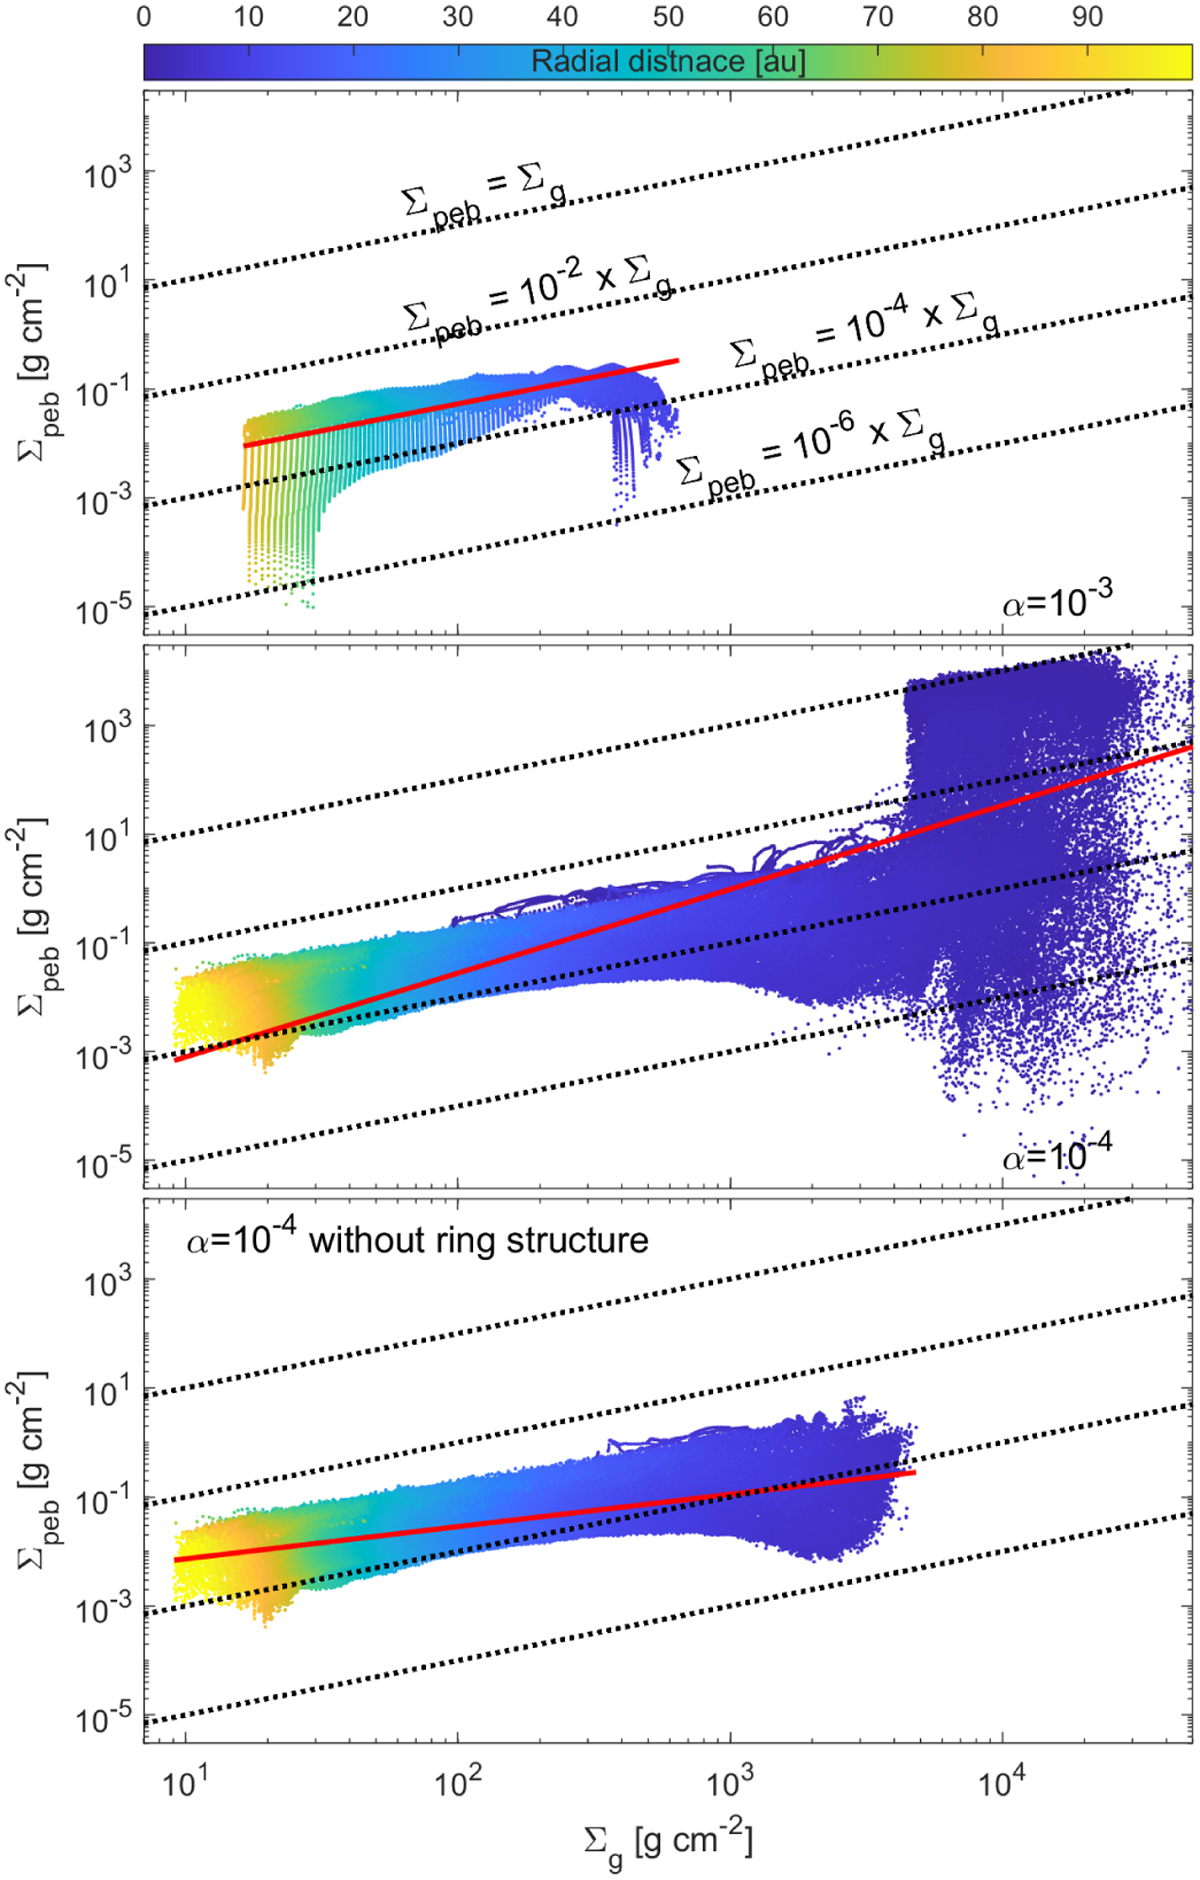
Relation between azimuthally averaged pebble ![]() and gas
and gas ![]() surface densities in the α = 10−3 model (top panel), α = 10−4 model (middle panel), and α = 10−4 model but without the ring (bottom panel). The dotted lines show the linear correlations
surface densities in the α = 10−3 model (top panel), α = 10−4 model (middle panel), and α = 10−4 model but without the ring (bottom panel). The dotted lines show the linear correlations ![]() with C changing from 1.0 to 10−6. The red lines show the power-law fitting to the model data.
with C changing from 1.0 to 10−6. The red lines show the power-law fitting to the model data.
Current usage metrics show cumulative count of Article Views (full-text article views including HTML views, PDF and ePub downloads, according to the available data) and Abstracts Views on Vision4Press platform.
Data correspond to usage on the plateform after 2015. The current usage metrics is available 48-96 hours after online publication and is updated daily on week days.
Initial download of the metrics may take a while.