Fig. 3
Download original image
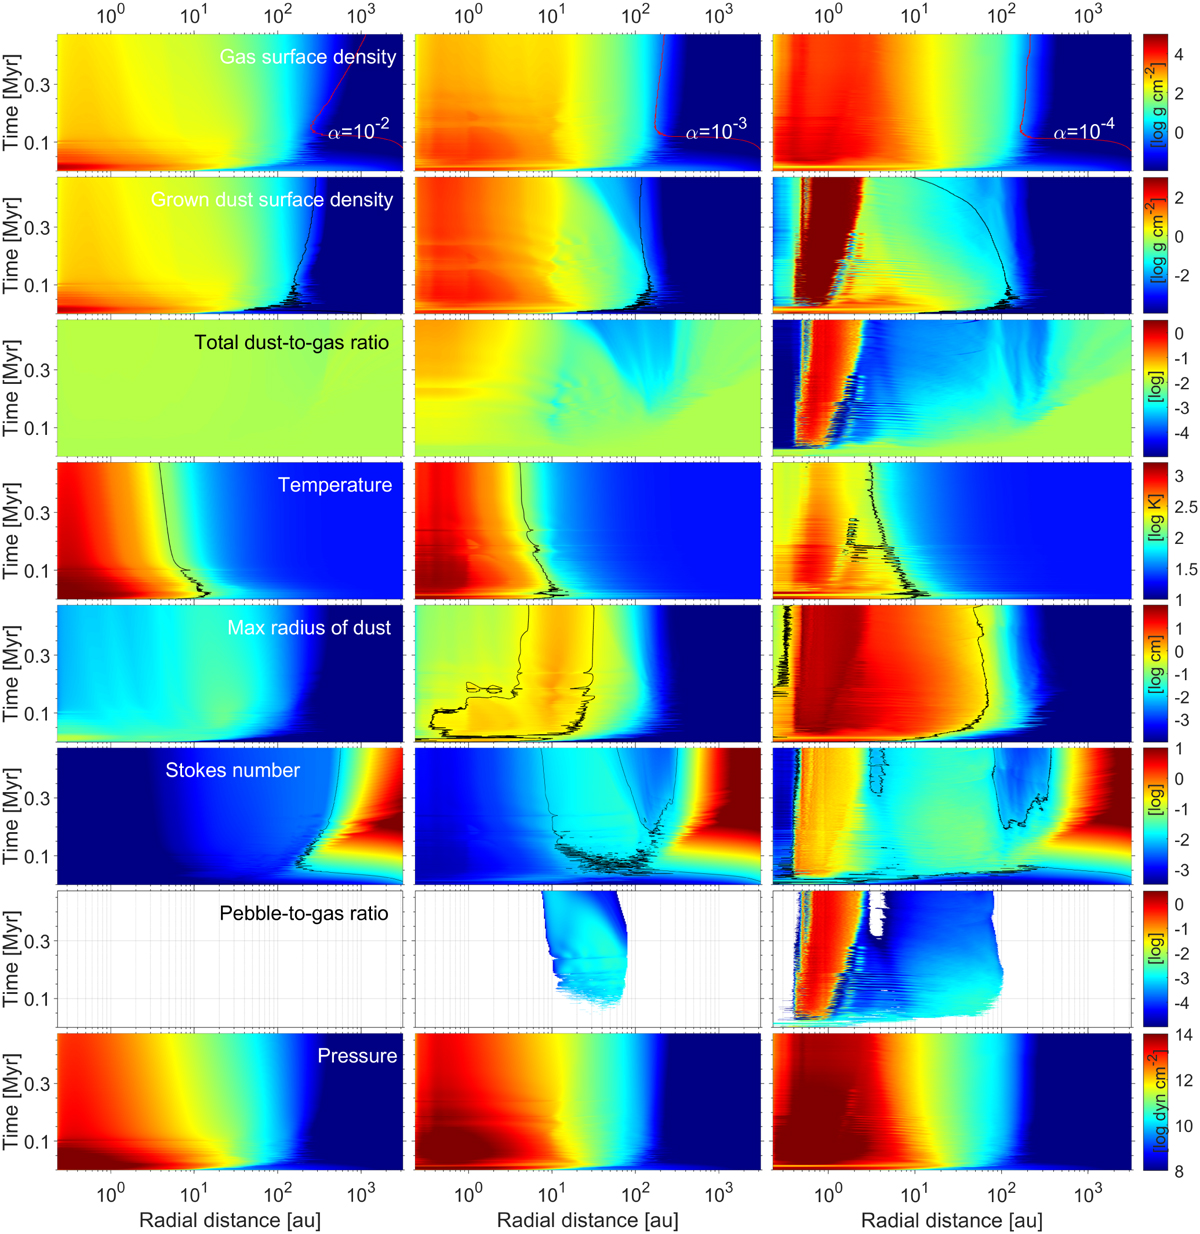
Temporal evolution of the azimuthally averaged gas surface density (first row), grown dust surface density (second row), total dust-to-gas mass ratio (ζd2g ; third row), temperature (fourth row), maximum radius of grown dust (fifth row), Stokes number (sixth row), pebble-to-gas mass ratio (ζp2g; second-to-bottom row), and gas pressure (bottom row) for models with different α parameters. Color bars are shown in log scale. The contour lines in the top and second-to-top rows mark the radial distances ![]() and
and ![]() , which are the characteristic radial distances containing 98% of the total (disk+envelope) gas and grown dust, respectively. The contour line in the fourth row shows the radial distance at which the gas temperature is equal to 150 K. The contour line in the fifth row marks the disk regions, where dust size is larger than 0.5 mm. The contour line in the third-to-bottom row outlines the region of the disk with St ≥ 0.01.
, which are the characteristic radial distances containing 98% of the total (disk+envelope) gas and grown dust, respectively. The contour line in the fourth row shows the radial distance at which the gas temperature is equal to 150 K. The contour line in the fifth row marks the disk regions, where dust size is larger than 0.5 mm. The contour line in the third-to-bottom row outlines the region of the disk with St ≥ 0.01.
Current usage metrics show cumulative count of Article Views (full-text article views including HTML views, PDF and ePub downloads, according to the available data) and Abstracts Views on Vision4Press platform.
Data correspond to usage on the plateform after 2015. The current usage metrics is available 48-96 hours after online publication and is updated daily on week days.
Initial download of the metrics may take a while.