Open Access
Fig. A.1
Download original image
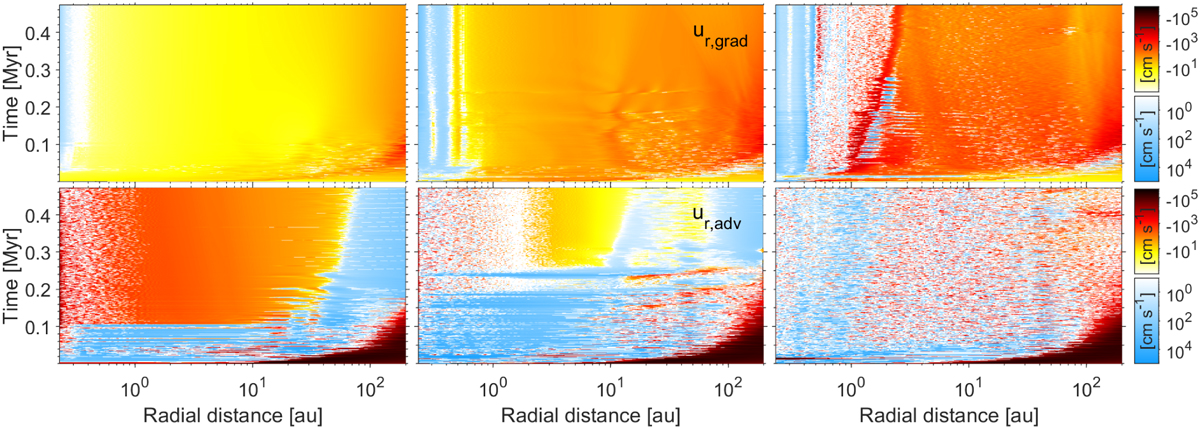
Space-time diagrams of the azimuthally averaged components of the grown dust drift velocity, ur,grad (top row) and ur,adv (bottom row), for three models with α = 10−2 (left column), α = 10−3 (middle column), and α = 10−4 (right column). The hot colors corresponds to the inward drift and the cold colors to the outward drift.
Current usage metrics show cumulative count of Article Views (full-text article views including HTML views, PDF and ePub downloads, according to the available data) and Abstracts Views on Vision4Press platform.
Data correspond to usage on the plateform after 2015. The current usage metrics is available 48-96 hours after online publication and is updated daily on week days.
Initial download of the metrics may take a while.