Open Access
Fig. 1
Download original image
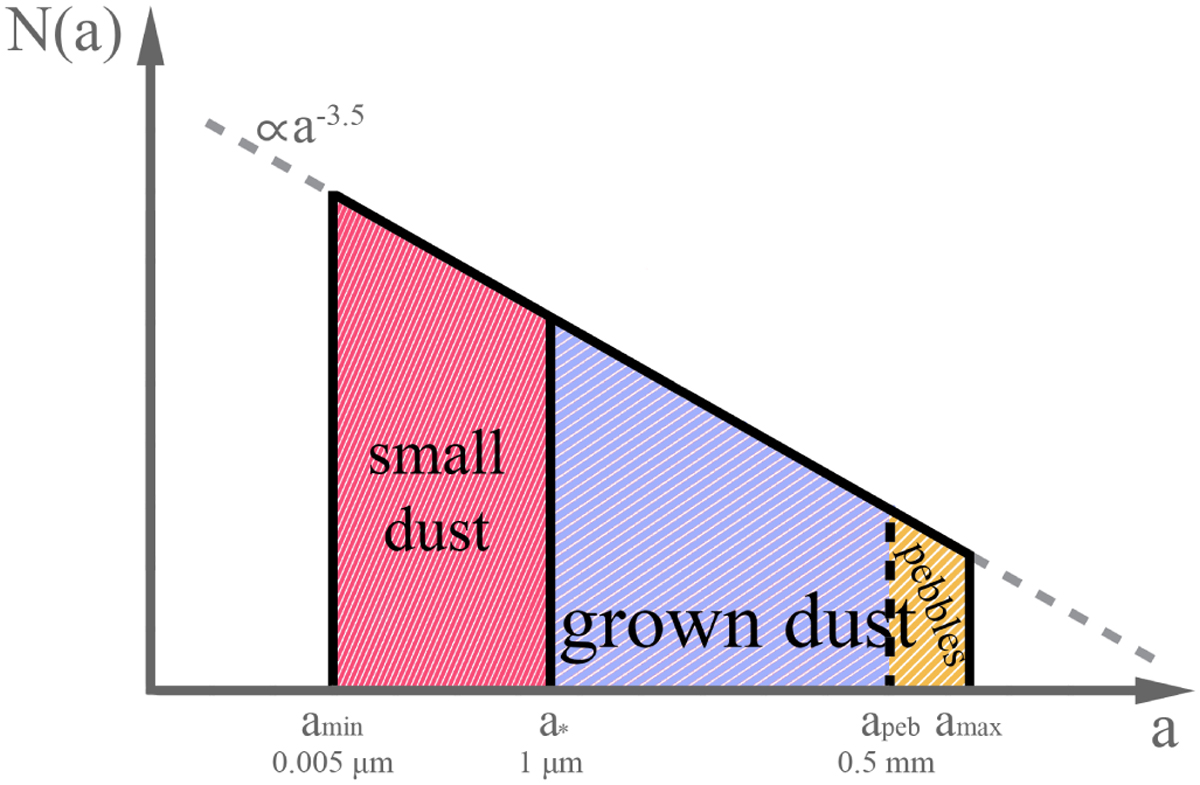
Illustration of the dust size distribution in our model. The red area represents the amount of small dust, the blue and orange areas together represent the amount of grown dust, while the orange-only area represents the amount of pebbles.
Current usage metrics show cumulative count of Article Views (full-text article views including HTML views, PDF and ePub downloads, according to the available data) and Abstracts Views on Vision4Press platform.
Data correspond to usage on the plateform after 2015. The current usage metrics is available 48-96 hours after online publication and is updated daily on week days.
Initial download of the metrics may take a while.