Fig. 4
Download original image
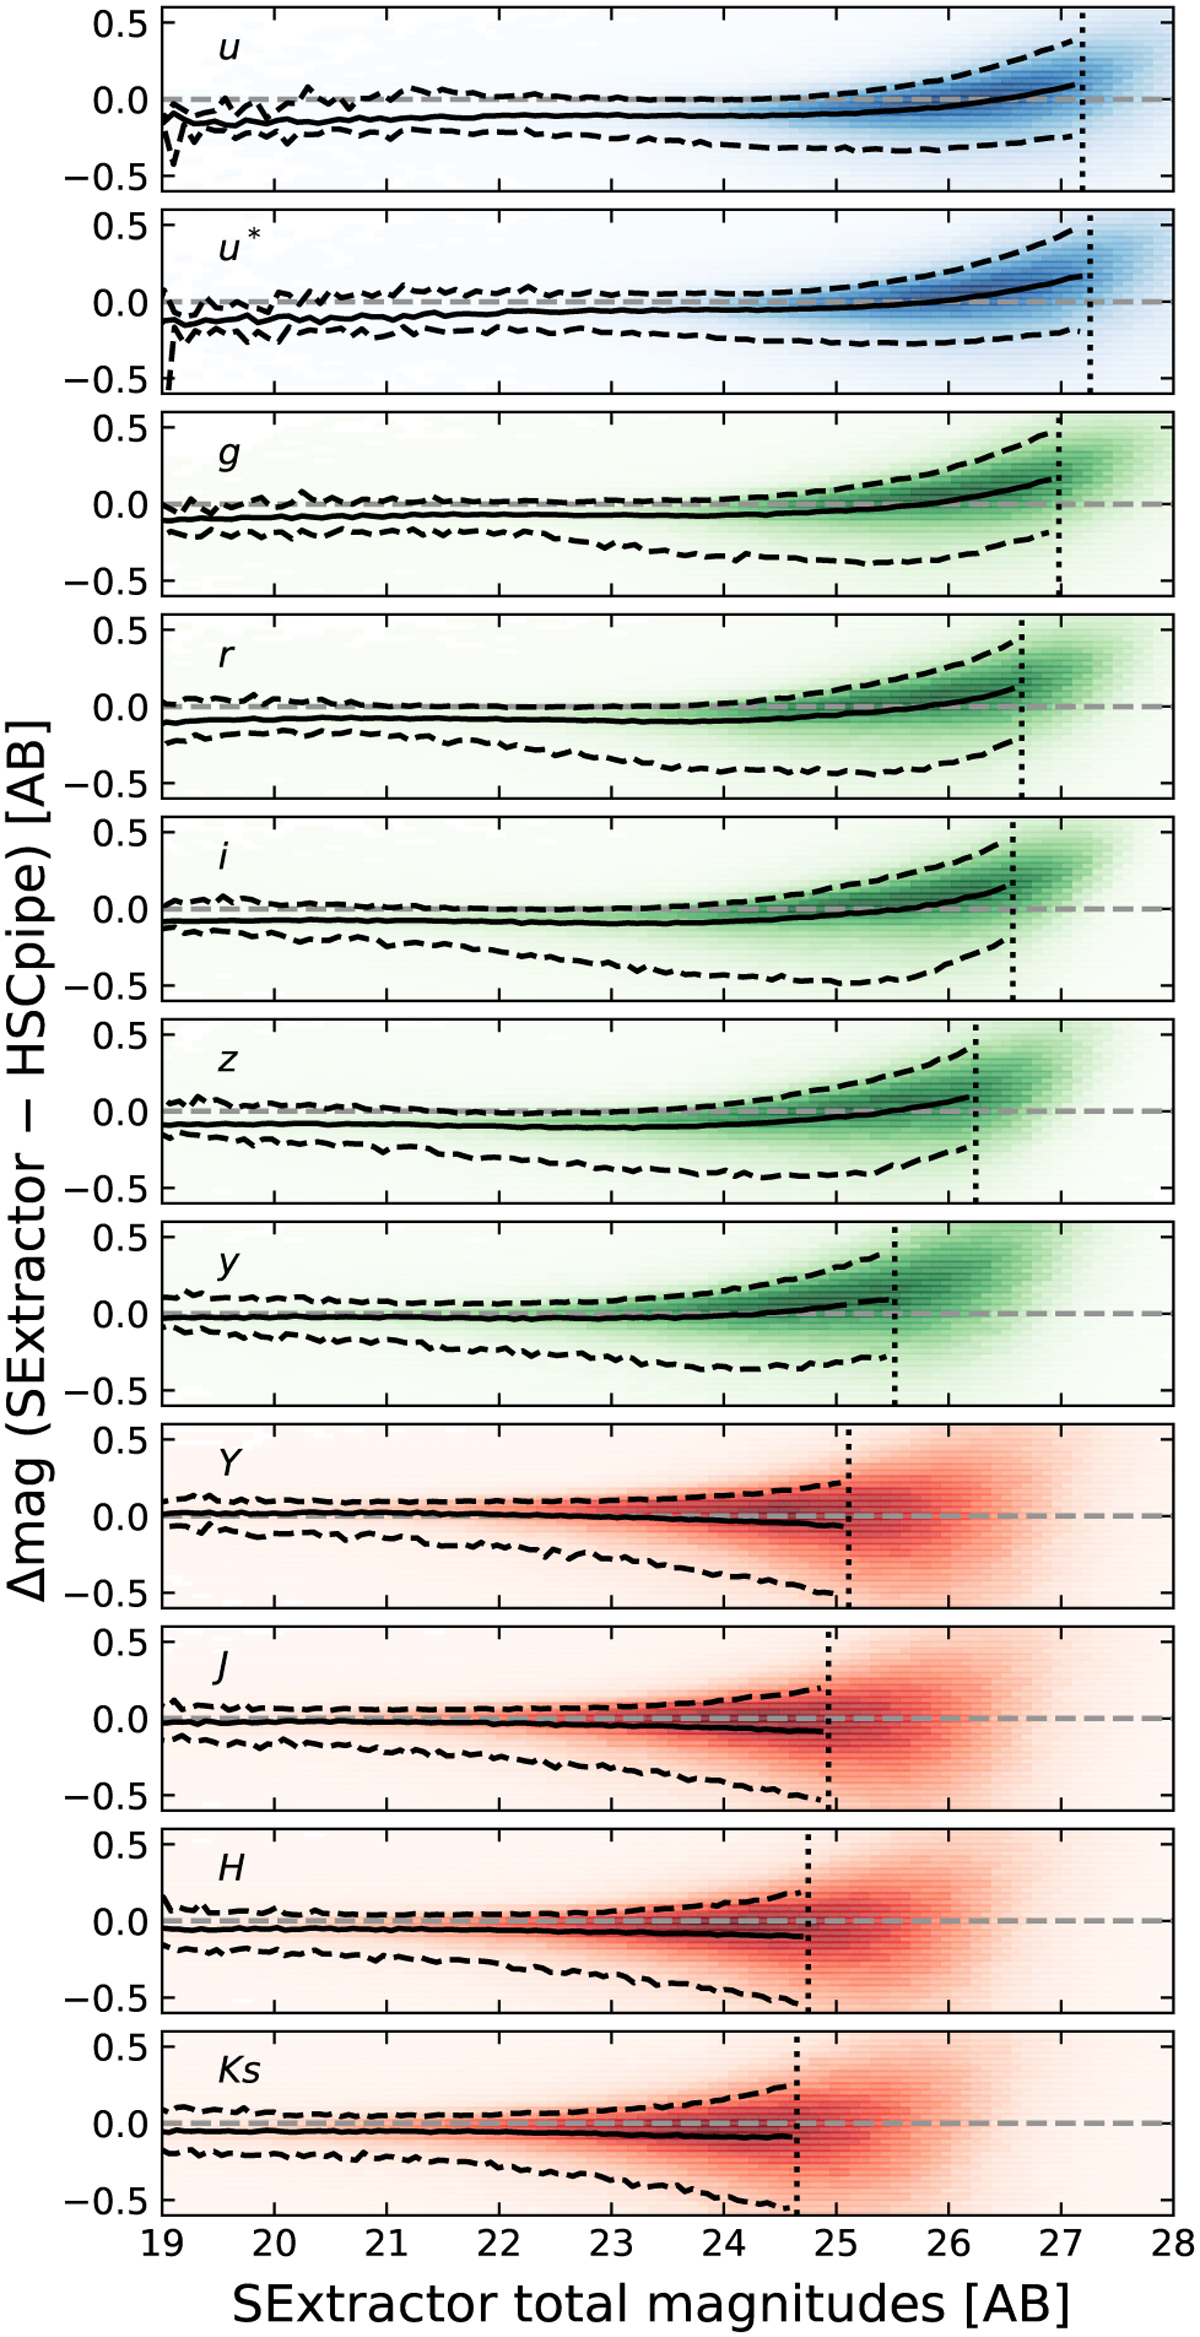
Comparison of hscPipe cmodel magnitudes with SExtractor total magnitudes. The color shades show the density of sources. The solid lines are the median of the distributions and the dashed lines are the ±34% intervals around the medians. These values are computed down to the 5σ depth in each band in the E-COSMOS ultraDeep region (vertical dotted line).
Current usage metrics show cumulative count of Article Views (full-text article views including HTML views, PDF and ePub downloads, according to the available data) and Abstracts Views on Vision4Press platform.
Data correspond to usage on the plateform after 2015. The current usage metrics is available 48-96 hours after online publication and is updated daily on week days.
Initial download of the metrics may take a while.