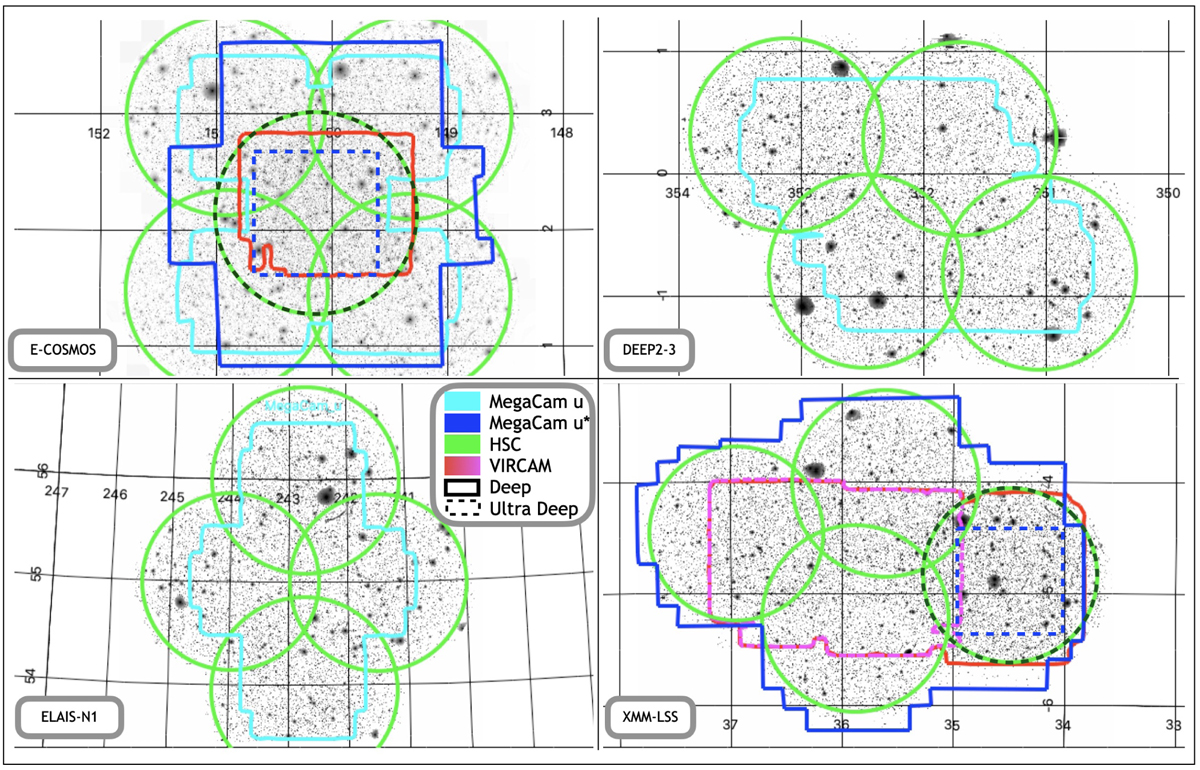
Fig. 2
Download original image
Detection images in the four CLAUDS-HSC fields. The footprints of the different observations are over-plotted in different colors: The CLAUDS Deep layer u and u⋆ bands in blue; the HSC-SSP grizy data in green; the VIDEO Near Infrared data in red (except in the XMM-LSS field where only two J band pointings are available, colored in pink). The footprints of the ultraDeep areas are shown with dashed lines.
Current usage metrics show cumulative count of Article Views (full-text article views including HTML views, PDF and ePub downloads, according to the available data) and Abstracts Views on Vision4Press platform.
Data correspond to usage on the plateform after 2015. The current usage metrics is available 48-96 hours after online publication and is updated daily on week days.
Initial download of the metrics may take a while.