Open Access
Fig. 13
Download original image
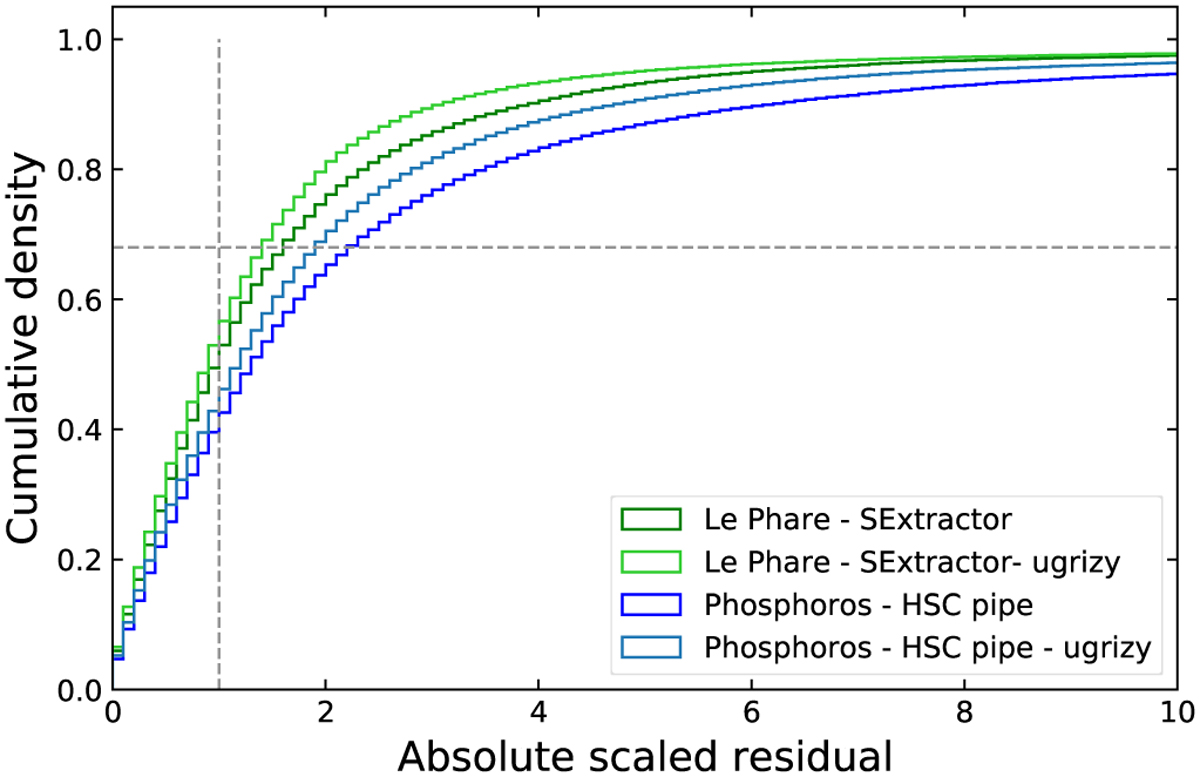
Absolute scaled residuals (Dz) cumulative distributions for the two implementations (HPH: blue lines and SLP: green lines) with the optical (light lines) and optical+NIR (dark lines) catalogs. The horizontal dashed gray lines show the 68% level that all the distributions should cross at Dz = 1 (vertical dashed line).
Current usage metrics show cumulative count of Article Views (full-text article views including HTML views, PDF and ePub downloads, according to the available data) and Abstracts Views on Vision4Press platform.
Data correspond to usage on the plateform after 2015. The current usage metrics is available 48-96 hours after online publication and is updated daily on week days.
Initial download of the metrics may take a while.