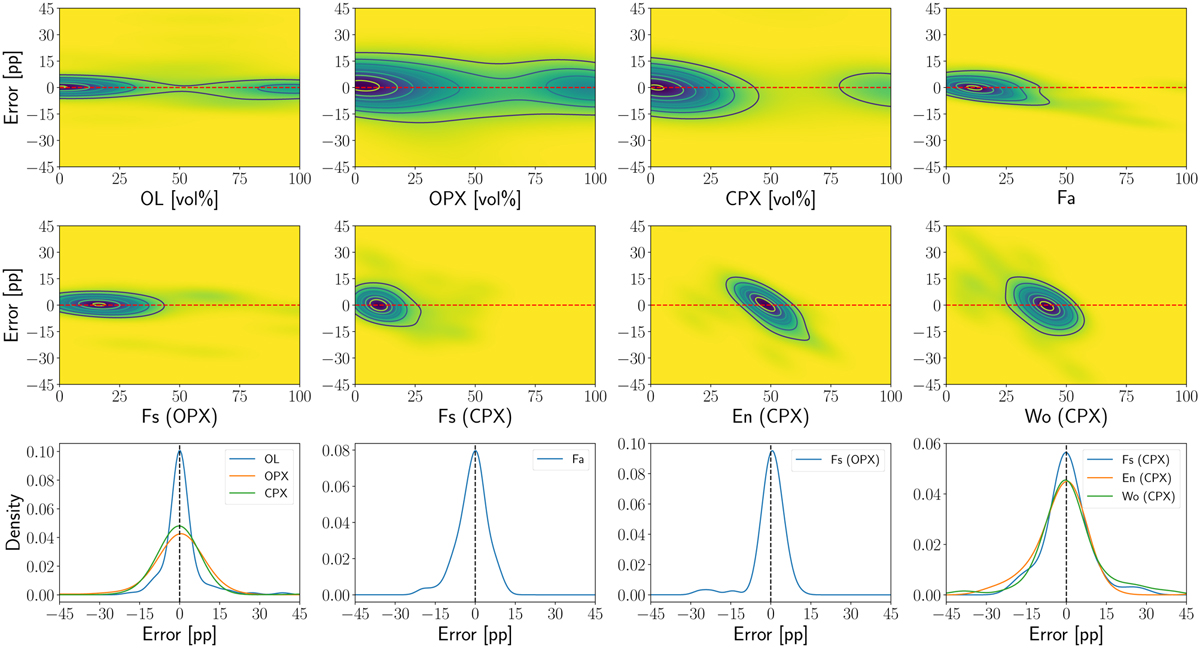
Fig. 8
Download original image
Density plots based on error predictions (predicted minus actual) and specific compositions. The dashed lines delimit zero error. Top and middle rows: concentrations of the test data as a function of composition and error. Bottom row: error distributions. Biases are present when the error is dependent on the composition, the mean value of error is significantly non-zero, or when the error distributions are asymmetrical.
Current usage metrics show cumulative count of Article Views (full-text article views including HTML views, PDF and ePub downloads, according to the available data) and Abstracts Views on Vision4Press platform.
Data correspond to usage on the plateform after 2015. The current usage metrics is available 48-96 hours after online publication and is updated daily on week days.
Initial download of the metrics may take a while.