Open Access
Fig. 3
Download original image
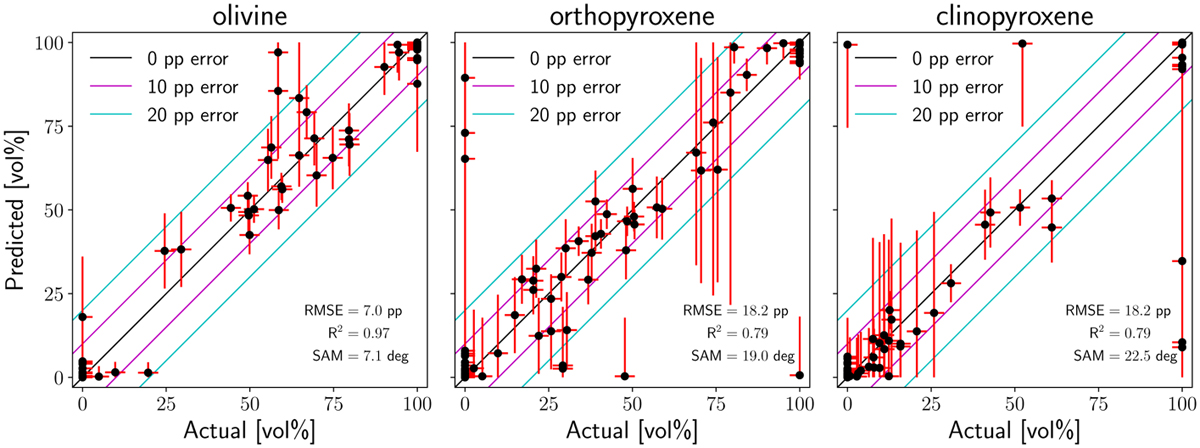
Scatter plots of the true and predicted modal compositions of the test data. The diagonal lines delimit the accuracy of the predictions. Error bars in actual values (horizontal) are considered as a conservative analytical error of 3 pp, and in predicted values (vertical), they correspond to the RMSE errors given in Table 3.
Current usage metrics show cumulative count of Article Views (full-text article views including HTML views, PDF and ePub downloads, according to the available data) and Abstracts Views on Vision4Press platform.
Data correspond to usage on the plateform after 2015. The current usage metrics is available 48-96 hours after online publication and is updated daily on week days.
Initial download of the metrics may take a while.