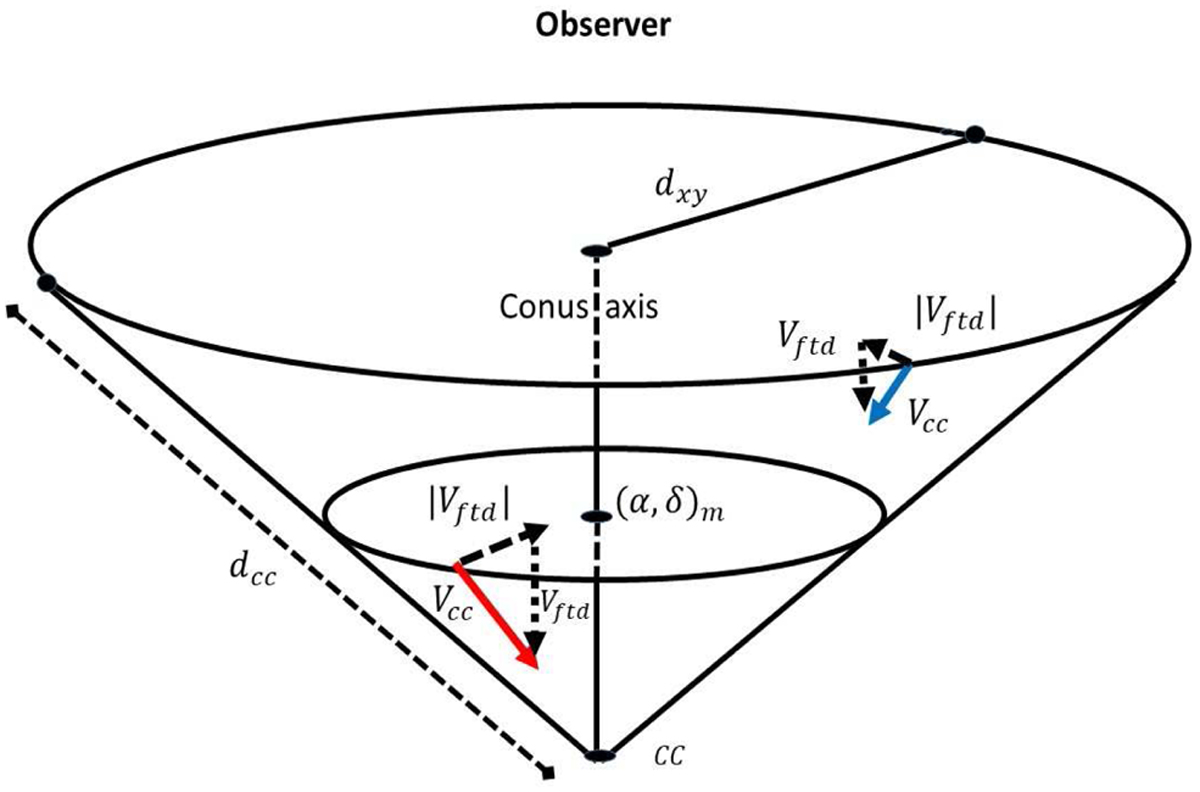
Fig. 7
Download original image
Model of the contraction velocities, Vcc, of the OH spots, i.e. of their velocities towards a common centre of contraction (CC). Vftd (represented with dotted lines) corresponds to the velocity from the straight line fitted to the observed data for the given distance to (α, δ)m, as may be seen in Fig. 3. This velocity is assumed to be the radial component of the contraction velocity. Each spot has its own velocity (the two Vftd, represented here, are different to each other in magnitude). The small ellipse corresponds to the small circle plotted in Fig. 5. For an assumed spot at a point in this circle, |Vftd| is the magnitude of the transversal velocity, which is directed to the CONUS axis (and orientated perpendicular to it). The |Vftd| of the spot at the large ellipse is smaller than that at the small one. The resulting contraction velocity, of a magnitude, Vcc, lies on the surface of the CONUS and it is directed to the CC point (the apex of the CONUS).
Current usage metrics show cumulative count of Article Views (full-text article views including HTML views, PDF and ePub downloads, according to the available data) and Abstracts Views on Vision4Press platform.
Data correspond to usage on the plateform after 2015. The current usage metrics is available 48-96 hours after online publication and is updated daily on week days.
Initial download of the metrics may take a while.