Fig. 6
Download original image
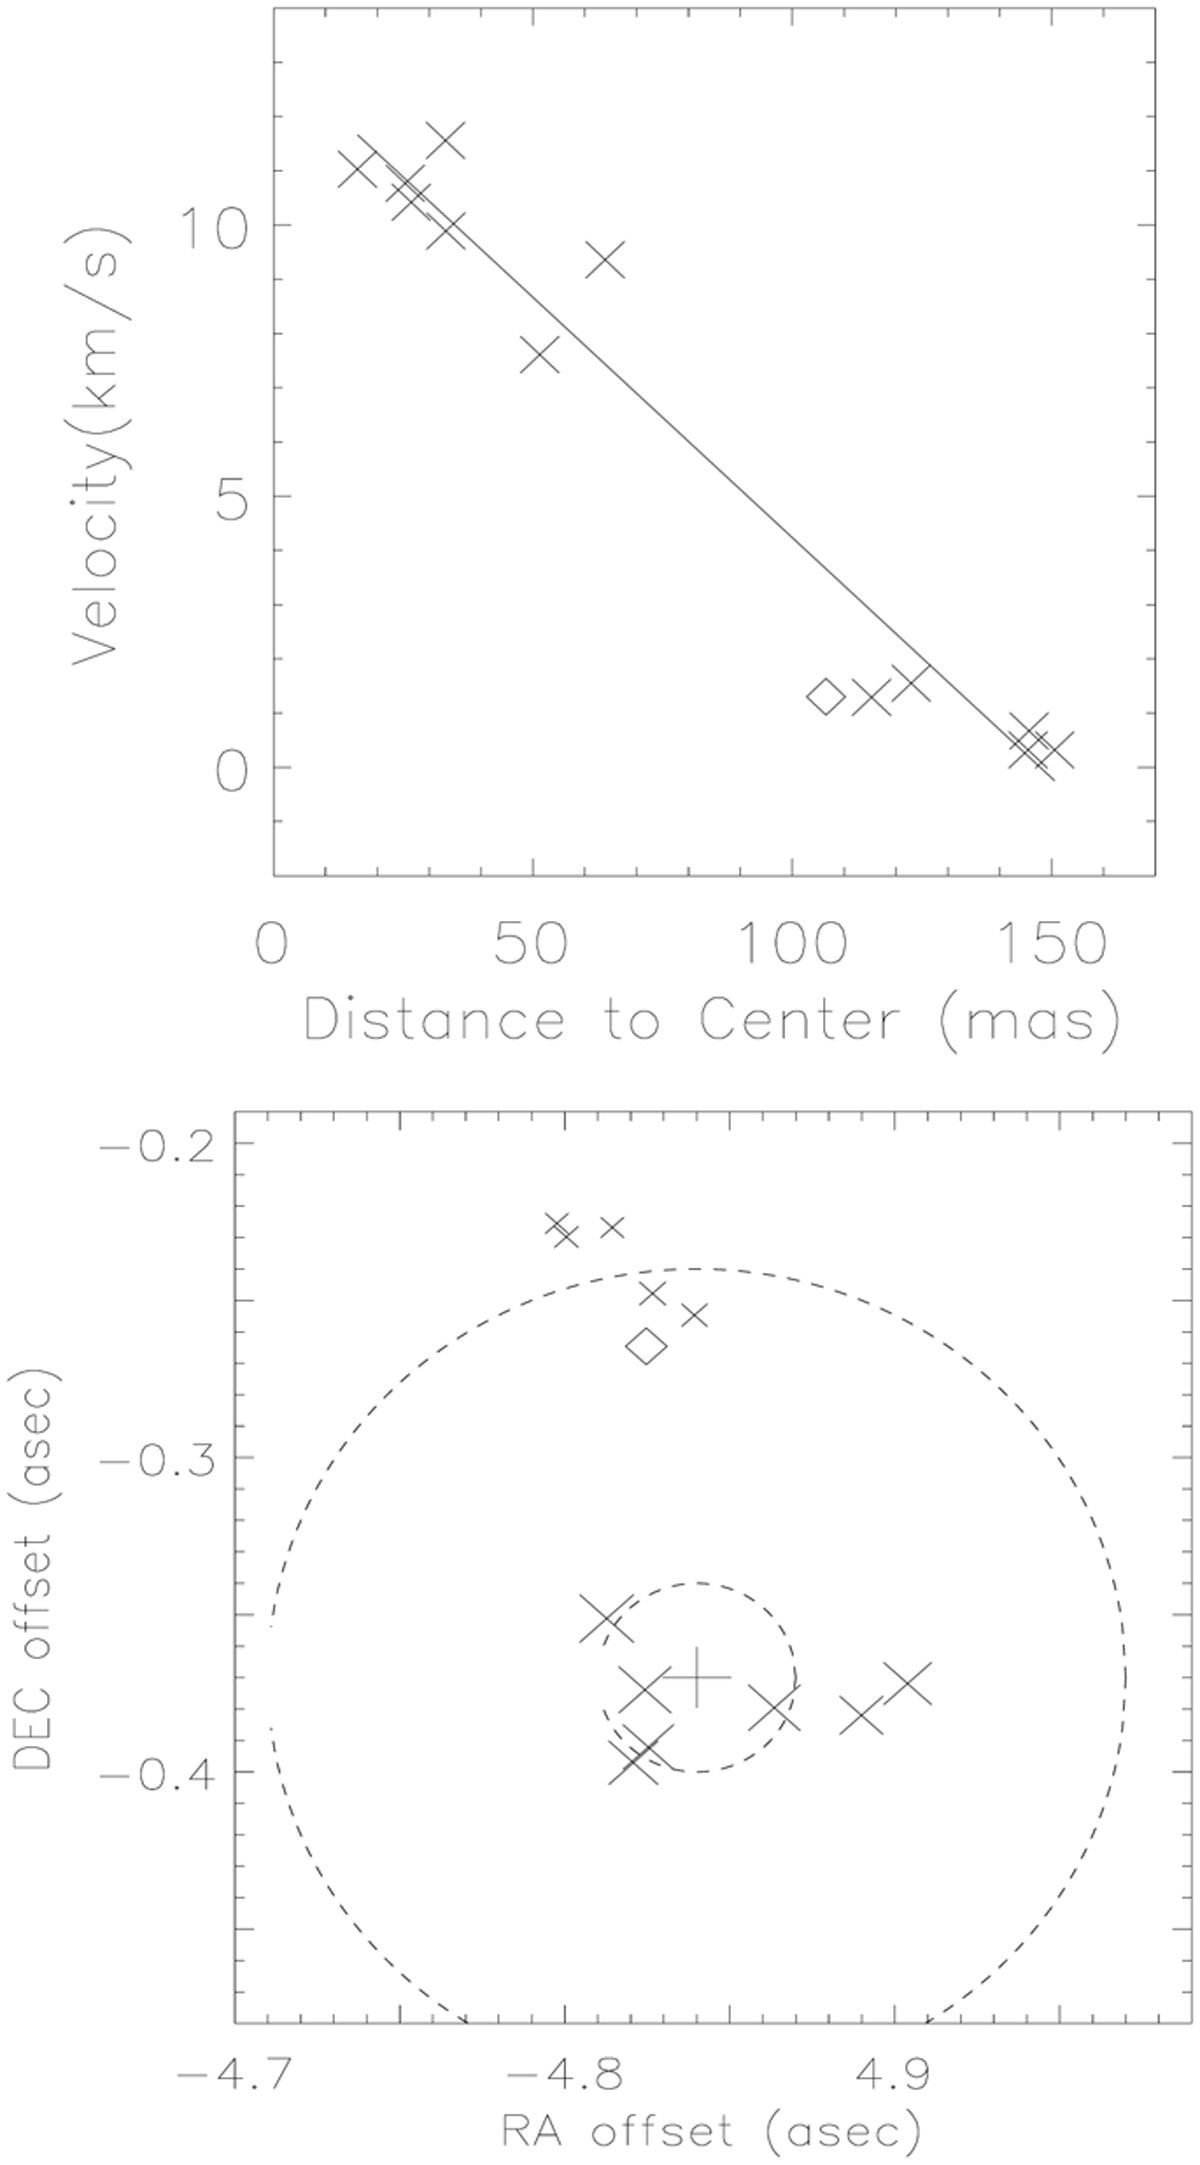
Crosses indicate the Vpk−Vsys velocities against the d(α,δ)mMeth distances (to the point C(α,δ)mMeth) of the methanol cloudlets observed by Bartkiewicz et al. (2014), shown at the top. The rhombus indicates the Vpk-Vsys velocity against d(α,δ)mMeth of the Pandian et al. (2011) spot that lies in this FOV. Crosses (×) indicate the locations of the Bartkiewicz et al. (2014) methanol cloudlets and the rhombus, as well as the Pandian et al. (2011) methanol cloudlet, all of them given as offsets in asec, with respect the OH VLBA reference coordinates, shown at the bottom. The size of the symbols is proportional to the velocity. The cross (+) indicates the location where the maximum correlation between Vpk−Vsys and the distance d(α,δ)mMeth is attained. The distance, d(α,δ)mMeth, used in the top-panel plot is computed from this point. Dashed circles are plotted for reference at 30 and 130 mas from C(α,δ)mMeth.
Current usage metrics show cumulative count of Article Views (full-text article views including HTML views, PDF and ePub downloads, according to the available data) and Abstracts Views on Vision4Press platform.
Data correspond to usage on the plateform after 2015. The current usage metrics is available 48-96 hours after online publication and is updated daily on week days.
Initial download of the metrics may take a while.